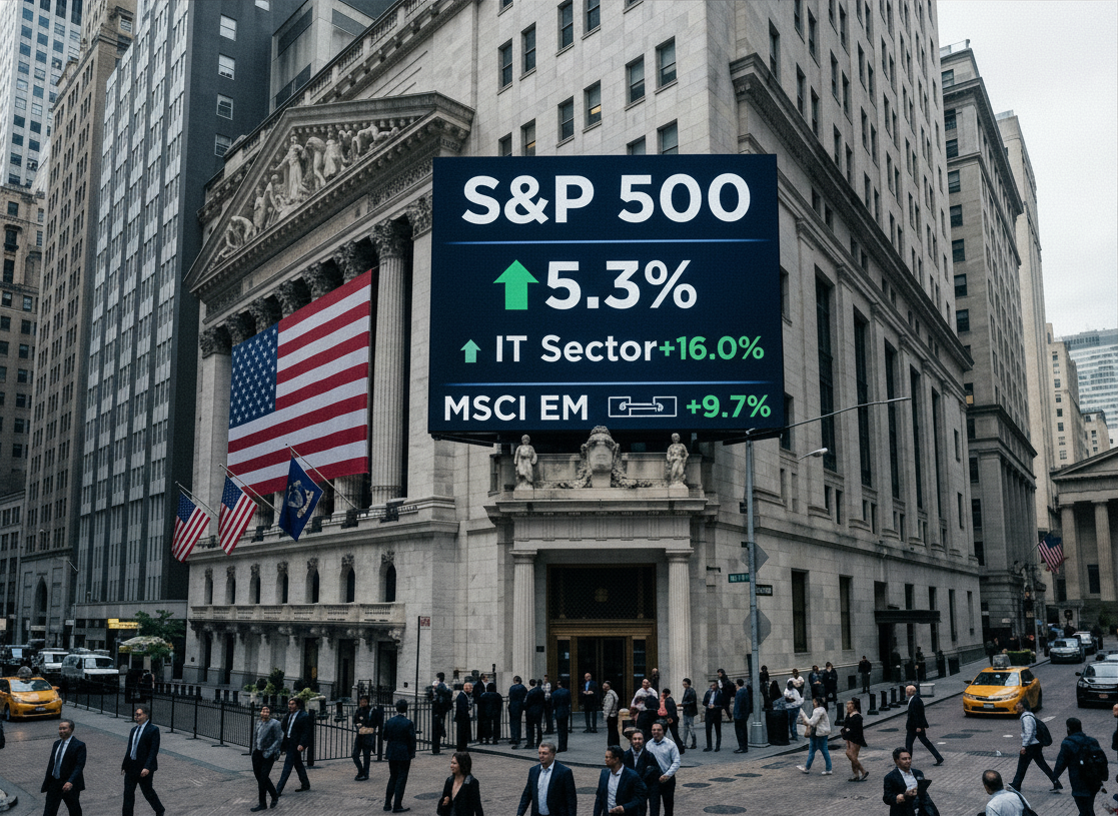
The Great Wall Street Dilemma of 2026
More than $2 trillion has been committed to AI infrastructure for 2026–2028. The market no longer accepts promises. It wants to see the money.
VenQuest Research View
The AI cycle itself is not in question. What is in question, and this is the crucial distinction for any investor with exposure to the technology sector, is the price the market was willing to pay for it without evidence. That distinction, seemingly subtle, changes everything.
The long-run thesis remains intact. Morgan Stanley estimates that nearly $3 trillion in AI infrastructure investment will flow through the global economy by 2028, with more than 80% of that spending still ahead (Morgan Stanley, 2026). Goldman Sachs projects that if hyperscaler capex reaches between $1.1 and $1.4 trillion by 2027, this cycle will rival the scale of the railroad and telecom booms of prior decades, both of which, it is worth recalling, ultimately delivered genuine productivity gains (Goldman Sachs, December 2025). There is more than enough fundamental grounding to stay in the trade.
That said, timing and sizing matter today in a way they simply did not in 2023 or 2024. The S&P 500 is running at the 87th percentile of historical valuations (Goldman Sachs, June 2026). Hyperscaler capex is already consuming close to 90% of operating cash flow (Barclays, cited in Reuters / Investing.com, April 2026). Big Tech’s debt issuance in the first quarter of 2026 alone outpaced everything issued in all of 2025 (Allianz Trade, March 2026). And direct AI revenue still represents just 4% of what is being poured into infrastructure (Investing.com, February 2026). None of that is an argument to sit on the sidelines. All of it is an argument to size positions with discipline, define stop-losses before you pull the trigger, and be honest about the fact that the structural returns from this cycle will be measured in years, not quarters.

At VenQuest Research, our read is straightforward: the market has entered its ‘show me the money’ phase, and that phase tends to be volatile but also clarifying. It exposes who has a real monetization model and who has been coasting on narrative optimism for two years.
The companies that can tie capex to auditable revenue, a diversified backlog, and expanding margins are today’s strongest long-run candidates. Those that cannot quantify the return on their AI spending, because they genuinely do not know yet, represent idiosyncratic risk that any disciplined book should size carefully. That distinction, more than any other, is the investment map that defines the second half of 2026.
The year Wall Street stopped taking it on faith

Wall Street, which for two years had almost automatically rewarded any company that spoke the right language about artificial intelligence, decided without warning that language was no longer enough. What it wanted now were numbers. Auditable ones.
The exact moment that shift became undeniable was April 29, on Meta’s earnings call. An analyst, with the patience of someone who had been waiting months for a straight answer, pressed CEO Mark Zuckerberg on the return on the $125–145B the company is tracking to spend on AI capex in 2026. Zuckerberg called it ‘a very technical question.’ The stock sold off 6% in after-hours trading, in a quarter where revenue had grown 33% and profits had surged 61% (StrongMocha / Q1 2026 Earnings Analysis, 2026). The market was not punishing the results. It was punishing the non-answer. That distinction explains everything.
Because that episode was not an isolated incident: it was the most visible symptom of a regime change Goldman Sachs had already mapped with precision: the price correlation among major AI stocks had collapsed from 80% to 20% since June 2025, driven by the degree of investor confidence that AI investments were actually generating revenue benefits (Goldman Sachs, December 2025). In other words, the market had stopped moving AI stocks as a bloc. It was now differentiating. And it was differentiating on a single variable: can you show me the money?
Oracle, meanwhile, became the case study no one could ignore. The stock had collapsed nearly 60% from its September 2025 peak, crushed by concerns about backlog concentration in OpenAI and the debt load piling up to fund its data center buildout (Investing.com, March 2026). Then came March 10, with fiscal Q3 results showing cloud revenue of $8.9B, a 44% year-over-year jump, and an AI contract backlog above $29B across a diversified client base. The stock bounced back 9% in a single session (CNBC, March 11, 2026). The difference between the collapse and the recovery was not the company. It was the evidence.
A mountain of spend and a river of doubt
To understand why this debate broke out now rather than earlier, it helps to step back and look at the sheer scale of what is on the line, because the numbers, in this case, are genuinely hard to process. The five largest U.S. technology spenders are on track to commit over $600B in capex in 2026 alone, as part of an estimated $2.1 trillion deployment through 2026–2028, pushing capital intensity to 34% of revenue, more than double the 15% peak seen at the height of the 1990s telecom boom (Allianz Trade, March 2026). Hyperscaler capex surpassed $400B in 2025 and is heading toward $700B in 2026, a level five times higher than just five years ago (J.P. Morgan Asset Management, February 2026).
Against that mountain of spend, the visible return is still surprisingly thin. Bank of America calculated that hyperscaler capex is already consuming 94% of operating cash flow after dividends and buybacks (Investing.com, February 2026), while AI services today generate roughly $25B in direct revenue, approximately 4% of what is being poured into infrastructure (Investing.com, February 2026). And the drag is not going away anytime soon: Goldman Sachs estimates depreciation and amortization will climb from 7% of revenue in 2022 to 12% by 2027, as data center construction converts upfront spending into fixed costs that will compress margins for years (Goldman Sachs, cited in Investing.com, June 2026).
What makes the picture even more complicated is that the funding architecture of these giants has quietly shifted in nature, largely without anyone announcing it.
For years, hyperscalers self-funded capex from their own operating cash flow, a feature that in principle distinguished this cycle from the telecom bubble of the 1990s, which was financed primarily with third-party debt. That buffer is eroding. By the first quarter of 2026, Big Tech had already issued more debt than in all of 2025, over $100B in bonds in the first three months alone (Allianz Trade, March 2026). Goldman Sachs projects up to $1.5 trillion in technology debt issuance over the coming years (Investing.com, February 2026). Balance sheets that ignored the bond market for a decade are starting to look increasingly like those of capital-intensive industrials.
And on top of all that sits the permissiveness the market extended to itself for far too long. Goldman Sachs documented that more than half of S&P 500 companies discussed AI-linked productivity initiatives on their most recent earnings calls, but relatively few put a number on the financial impact (Goldman Sachs, June 2026). For two years, that was fine. In Q1 2026, the market decided it was no longer acceptable. Alphabet (which reported cloud revenue of $20B+ growing 63%, AI products up 800% year-over-year, and a $460B backlog) saw its stock move up post-results. Meta (with stronger operating results but no quantifiable answer on AI capex ROI) sold off 6% in the same period (StrongMocha, 2026). Same quarter. The only variable: evidence.
When the index stops being a safe haven
This debate carries consequences that stretch well beyond Meta or Oracle. They reach the S&P 500 itself as an investment instrument, and that makes this an urgent issue for any book that uses the index as a reference. With the index trading at 21 times forward earnings (the 87th percentile since 1980) and return on equity printing a record 22% in Q1 2026, the margin for error is effectively zero (Goldman Sachs, June 2026).
Goldman strategist Ben Snider estimates that every one-percentage-point change in S&P 500 ROE corresponds to roughly a one-turn change in the market’s price-to-earnings multiple (Goldman Sachs, June 2026). Any profitability erosion (driven by rising depreciation, growing debt-service costs, or capex-induced margin compression) feeds directly into multiple contraction. At 21x forward P/E, the market is not priced for setbacks.
And market concentration amplifies that risk in ways many investors have not fully internalized. Since 2022, the top 10 stocks, predominantly AI-linked, have accounted for more than 58% of the S&P 500’s gain in market capitalization, with that same group now concentrating close to 40% of the index’s total value (GWK Invest, October 2025).
The Magnificent 7’s share of total S&P 500 capex has surged from 10% to 30% over the last six years. That means if this small group’s AI investments fail to generate verifiable returns within the expected window, the blowback on broad indices would be deeply disproportionate. There is also a risk that gets less attention but may be broader in scope: the contagion effect on software. The IGV, the iShares Expanded Tech-Software Sector ETF, has shed 18% year-to-date in 2026 (CNBC, March 2026), under pressure from fears that AI capabilities, which were supposed to enrich software products, could instead cannibalize the customer base if hyperscalers bake those same capabilities directly into their cloud platforms (Goldman Sachs, December 2025).
The most uncomfortable historical parallel comes, once again, from Goldman Sachs: if hyperscaler capex hits between $1.1 and $1.4 trillion by 2027, this cycle rivals the scale of the railroad and telecom booms of prior decades. Both delivered genuine long-run productivity gains. Both also destroyed significant capital before the returns showed up (Goldman Sachs, cited in Investing.com, June 2026).

That is a warning about the horizon investors need to hold in mind. April 28, 2026 delivered a sharp reminder: a leak on OpenAI’s internal results, suggesting the company had missed its revenue and active-user targets, triggered an immediate selloff across the AI infrastructure chain. Oracle dropped roughly 3%, with Nvidia, Broadcom, and AMD following lower (HeyGoTrade, April 2026). A single headline was enough to remind the market that the single largest buyer of AI compute may be scaling slower than the buildout assumes.
Who is showing the money, and who is still promising to
Table 1. AI Monetization Scorecard: Q1 2026.
| Company | 2026E Capex | Return evidence | Market reaction | The read-through |
| Alphabet (GOOGL) | $185B | Cloud +63% YoY; AI products +800% YoY; backlog $460B | +pos post Q1 | Direct, auditable monetization loop. The market rewarded specificity, and punished everything that couldn’t match it (Q1 2026). |
| Meta (META) | $135–145B | Revenue +33%, profit +61%. Zero AI ROI metrics disclosed | –6% despite results | CEO called it ‘a very technical question’ when pressed on AI capex returns. Stock sold off hard post-earnings despite blowout P&L (Zuckerberg, Q1 2026). |
| Microsoft (MSFT) | $140–150B | Azure backlog $80B; CFO Hood: routing all GPUs to Azure would push growth above 40% | –neg post Q1 | Internal allocation headache. AI is playing out as a long-duration enabler, not a near-term cash flow driver (Bloomberg, Q1 2026). |
| Amazon (AMZN) | $200B | AWS +24%; FCF plunged 71% to $11.2B | –neg, choppy | Capex is crowding out free cash flow. Investors are pushing back on the Trainium and Graviton payback timeline (FinancialContent, 2026). |
| Oracle (ORCL) | $400B data center* | Cloud rev +44% YoY; backlog $29B+; OCI contracts diversified | +9% post Q3 (Mar) | Fell 60% from Sep peak on OpenAI concentration risk; snapped back once it demonstrated a diversified, revenue-converting pipeline (CNBC, Mar 2026). *10-year program. |
Sources: CNBC, Bloomberg, SEC filings, StrongMocha / Q1 2026 Earnings Analysis, Goldman Sachs Research, Investing.com.
The decision map for the investor arriving today
Given all of the above, the AI-profitability dilemma does not imply the infrastructure investment cycle is wrong: it implies the market has matured enough to demand that the cycle prove its economic logic in real time and in real numbers, not just projections. And that maturity carries very concrete consequences for portfolios.
The first is that the market is no longer paying for spend. It is paying for verifiable return. Goldman Sachs flagged that investors have been rotating toward companies demonstrating a clear link between capex and revenue (Goldman Sachs, December 2025). Morgan Stanley confirms that AI adopters are showing cash-flow margin expansion at roughly twice the global average (Morgan Stanley, 2026). The most compelling part of the investment universe right now: enterprise software with auditable AI-attributable revenue, cloud platforms that can connect workload growth to revenue growth, and companies in regulated industries documenting the quantifiable impact of AI on costs or productivity.
Running alongside that is something no one formally declared but that already operates as a rule: disclosure quality has become a valuation factor. Q1 2026 was the quarter the market started pricing the language executives used about AI. Companies that put specific AI-attributable revenue numbers on the table were rewarded. Those that fell back on qualitative language, along the lines of ‘we have a sense of the shape of where this needs to go,’ in Zuckerberg’s own words, were punished. Same quarter. Same types of operating results. The only difference: transparency (StrongMocha, 2026).
This makes the investment horizon as important as the thesis itself. J.P. Morgan Asset Management put it with unusual candor: ‘while advancements at the AI frontier appear exponential, business adoption has been more linear, jagged, and ridden with potholes from organizational bottlenecks, human behavior and unit economics’ (J.P. Morgan Asset Management, February 2026). The 2026–2030 window is the critical testing ground, when infrastructure investments will be largely complete and operational, creating real pressure to monetize those assets (GWK Invest, 2025). Getting into AI infrastructure today requires a minimum 36-month horizon and an explicit tolerance for multiple volatility through the proof-of-returns phase.
And finally, the distinction Morgan Stanley has identified as the most important return differentiator of the year: in major technology waves, equity value accrues not only to the technology suppliers but also, and often more durably, to the companies that apply the technology most effectively (Morgan Stanley, 2026). That argues for a two-layer portfolio structure: exposure to infrastructure leaders that can demonstrate real backlog and a diversified customer base, layered with positions in enterprise adopters showing AI-attributable margin expansion.
Wall Street is not walking away from the AI trade. It is pricing the gap between the cost of building it and the moment the profits finally show up. That price (measured in volatility, in multiple compression, and in the widening dispersion of returns across names) is the map a disciplined investor needs to read clearly before putting capital to work.
The signal dashboard
Table 2. Signal Dashboard: AI-Profitability Dilemma 2026.
| Indicator | 2026 level | Alert threshold | The read |
| Capex / Operating Cash Flow (Big 5) | 90% (Barclays, 2026) | Breaks above 100% | Already in the red zone. Debt is stepping in where internal cash flow used to be. |
| AI revenue-to-capex ratio | 4% ($25B/$660B) | Needs to clear 10% | The gap is the central risk. At $660B in spend, direct AI returns are still rounding-error territory. |
| S&P 500 ROE (record) | 22% in Q1 2026 | 1pp erosion = 1x PE | Goldman: any ROE slippage compresses multiples at 21x forward P/E. Zero margin for disappointment. |
| Big Tech debt issuance 2026 | $100B+ (Q1 alone) | On pace to match all of 2025 | Structural pivot to the bond market to fund capex. A balance-sheet stress signal (Allianz Trade, Mar 2026). |
| Capex as % of revenue | 34% in 2026E | Telecom bubble peak 90s: 15% | 2.3x the prior all-time high. The telecom-bubble parallel is not hyperbole: it’s arithmetic. |
| S&P 500 forward P/E | 21x (87th percentile since 1980) | Contingent on ROE holding | The index has no room to miss. Current multiples price in flawless execution, quarter after quarter. |
VenQuest Group analysis based on Goldman Sachs, J.P. Morgan, Barclays, Allianz Trade (June 2026).
References
- Allianz Trade. (2026, March 25). AI capex cycle war-proof for now. Allianz Trade Economic Research. https://www.allianz-trade.com/en_global/news-insights/economic-insights/AI-capex-cycle-war-proof-now.html
- CNBC. (2026, March 11). Oracle stock spikes 9% as strong Q3 earnings answer Wall Street AI build-out concerns. https://www.cnbc.com/2026/03/11/oracle-orcl-stock-q3-earnings-ai-data-center.html
- FinancialContent / MarketMinute. (2026, April 2). The AI Monetization Gap: Why Wall Street is Rewarding Results and Punishing Promises in 2026. https://markets.financialcontent.com/stocks/article/marketminute-2026-4-2
- Goldman Sachs. (2025, December 18). Why AI Companies May Invest More than $500 Billion in 2026. Goldman Sachs Insights. https://www.goldmansachs.com/insights/articles/why-ai-companies-may-invest-more-than-500-billion-in-2026
- Goldman Sachs. (2026, May 1). Tracking Trillions: The Assumptions Shaping the Scale of the AI Build-Out. Goldman Sachs Insights. https://www.goldmansachs.com/insights/articles/tracking-trillions-the-assumptions-shaping-scale-of-the-ai-build-out
- Goldman Sachs / Investing.com. (2026, June). Goldman Says The AI Spending Boom is Now a Risk to S&P 500 Returns. https://www.investing.com/analysis/goldman-says-the-ai-spending-boom-is-now-a-risk-to-sp-500-returns-200682129
- GWK Invest. (2025, October 7). When Will AI Investments Start Paying Off? https://www.gwkinvest.com/insight/macro/when-will-ai-investments-start-paying-off/
- HeyGoTrade. (2026, April 30). AI Capex Risk: Why AI Infrastructure Stocks Sold Off? https://www.heygotrade.com/en/blog/ai-capex-risk-openai-revenue-report/
- Investing.com. (2026, February 6). Big Tech Will Spend $600B on AI in 2026: 5 Stocks Cashing the Checks. https://www.investing.com/analysis/big-tech-will-spend-600b-on-ai-in-2026-5-stocks-cashing-the-checks-200674615
- Investing.com / Reuters. (2026, April 29). Hyperscaler results pose major test for AI-driven US stock market. https://www.investing.com/news/stock-market-news/hyperscaler-results-pose-major-test-for-aidriven-us-stock-market-4644097
- Investing.com. (2026, March 10). Oracle Earnings Preview: Wall Street Eyes Cloud Growth and AI Spending. https://www.investing.com/analysis/oracle-earnings-preview-wall-street-eyes-cloud-growth-and-ai-spending-200676384
- J.P. Morgan Asset Management. (2026, February 27). Artificial Intelligence: Guide to the Markets. https://am.jpmorgan.com/us/en/asset-management/institutional/insights/market-themes/artificial-intelligence/
- Morgan Stanley. (2026). AI Market Trends 2026: Global Investment, Risks, and Buildout. Morgan Stanley Institute for Sustainable Investing. https://www.morganstanley.com/insights/articles/ai-market-trends-institute-2026
- NAI 500. (2026, January 30). Earnings Showdown: Meta Pulls Ahead of Microsoft in AI Monetization Race. https://nai500.com/blog/2026/01/earnings-showdown-meta-pulls-ahead-of-microsoft-in-ai-monetization-race/
- StrongMocha / ThorstenMeyerAI. (2026, May). The Earnings Call Gap: What Q1 2026 Just Told Us About AI ROI. https://strongmocha.com/ai-infrastructure-data-centers/the-earnings-call-gap-what-q1-2026-just-told-us-about-ai-roi/
- 247 Wall St. (2026, May 6). Oracle Stock’s Breakout Is Real and the Long-Term AI Infrastructure Case Is Only Getting Stronger. https://247wallst.com/investing/2026/05/06/oracle-stocks-breakout-is-real-and-the-long-term-ai-infrastructure-case-is-only-getting-stronger/