U.S. Consumption, Employment and Corporate Earnings
The U.S. economy is sending two signals that don’t square with each other. On one hand, the labor market is losing steam, the consumer is turning more cautious, and growth is decelerating. On the other, corporate profits, both the economy-wide aggregate and the S&P 500’s, are sitting at record highs.

This disconnect between what’s happening to households and what companies are reporting is, in itself, the single biggest risk investors should be watching right now: not because one of the two data sets is “wrong,” but because divergences like this tend to resolve abruptly, and which way they resolve (does consumption drag earnings down, or do earnings end up confirming the economy is in better shape than sentiment suggests?) is exactly what’s on the line over the coming months.
By the Numbers
| Employment | Consumption | Corporate Earnings |
| Nonfarm payrolls: −23,000 (July) | Retail sales: −0.6% m/m (July) | S&P 500 earnings growth: +50.4% y/y (Q2) |
| Unemployment rate: 4.1% | Real spending (PCE): +0.2% m/m (July) | S&P 500 net margin: 15.7% (all-time high) |
| Labor force participation: 61.4% (−0.7 pp since January) | Consumer confidence: 51.0 (−7.6% m/m) | Aggregate corporate profits (BEA): +$400.9B in Q2 |
| Average hourly earnings: +3.2% y/y | 1-year inflation expectations: 4.3% | Real GDP: +1.5% annualized (Q2), down from 2.1% (Q1) |
What This Means for the Retail Investor
None of this data, taken alone, points to an imminent recession or justifies panic: unemployment remains low by historical standards, and corporate profits, far from collapsing, are sitting at record highs. The real risk isn’t any single data point, it’s the gap between what Main Street is reporting, jobs, real wages, confidence, and what the largest companies are reporting, a gap that tends to close at some point.
It’s worth it for individual investors to understand where the earnings growth propping up the major indices is actually coming from, how concentrated it is in a handful of names, how much of it rests on AI-related spending that hasn’t yet proven its return, and how much is simply a “base effect” in the year-over-year comparisons, before assuming recent corporate strength is representative of the broader economy’s health.
What follows walks through each piece on its own, then explains why the combination of the three matters more than any one of them in isolation.
The Labor Market
The Bureau of Labor Statistics’ (BLS) July 2026 jobs report showed a net loss of 23,000 nonfarm payrolls — the first negative print after average monthly gains of roughly 34,000 over the prior year. The unemployment rate came in at 4.1%, still low by historical standards, but that headline masks a more troubling signal: the labor force participation rate slid to 61.4%, seventy basis points below its January level. In other words, part of the stability in the unemployment rate owes to people dropping out of the labor force, not to there being enough jobs for everyone looking for one.
Just as telling were the downward revisions to prior months: May and June combined lost 103,000 jobs versus what was originally reported. When revisions run systematically negative like this, it’s usually a sign that underlying hiring momentum is weaker than the headlines had been suggesting month after month.
But the weakness isn’t evenly spread. Health care kept adding jobs (+22,000), though at a slower clip than its trailing 12-month average (36,000). Construction (+22,000) and professional and business services (+18,000) also contributed. Retail trade (-19,000), local government education (-50,000), financial activities (-14,000) and, notably, leisure and hospitality (-40,000) all pulled back. Average hourly earnings rose just 2 cents on the month (+3.2% y/y), a pace that, with inflation where it stands, leaves little room for real purchasing-power gains.
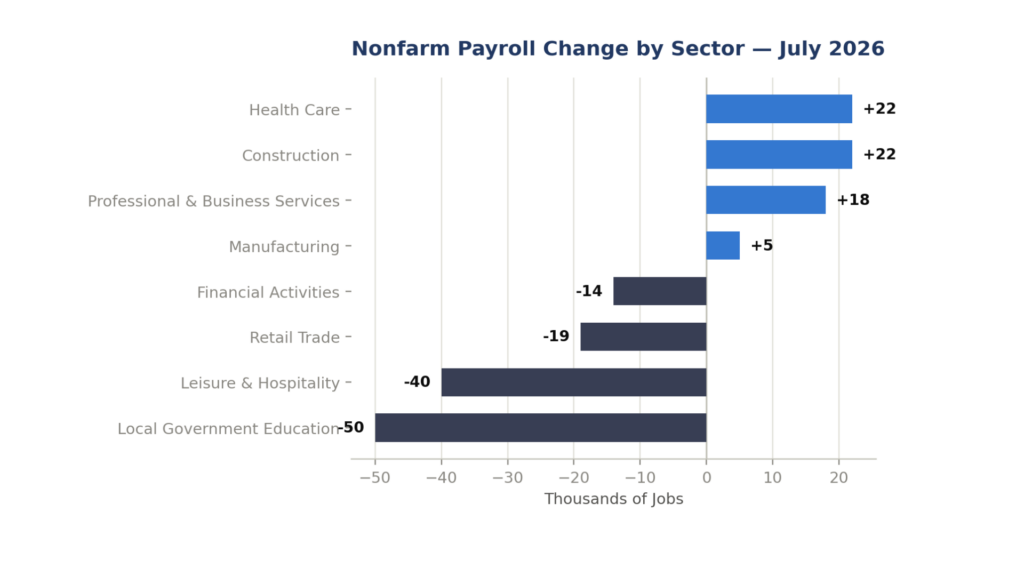
Exhibit 1. Nonfarm payroll change by sector, July 2026 (thousands of jobs). Source: BLS, The Employment Situation — July 2026.
The Consumer
Consumer spending (PCE) rose 0.2% in July, following a 0.3% gain in June, per the Bureau of Economic Analysis (BEA) — the economy is still spending, just at an increasingly modest clip. July retail sales, reported by the Census Bureau, fell 0.6% month-over-month to $763.6 billion, though they’re still up 5.0% year-over-year. That headline y/y gain, however, is inflated by gasoline prices (+16.2% y/y at service stations) — in other words, it largely reflects a price effect rather than higher purchase volumes. A subtler tell of fragility: furniture and home furnishings fell 1.2% y/y, a category that tends to lead weakness in big-ticket, rate-sensitive, housing-linked purchases.
Consumer confidence, as measured by the University of Michigan, tumbled in August to 51.0 from 55.2 in July — a 7.6% drop in a single month. One-year inflation expectations rose to 4.3%, and only 8% of respondents expect their income to outpace inflation over the next twelve months, down from 18% in December 2024. The deterioration was sharpest among lower-income households, older consumers, and those without a college degree — in other words, the segments with the least cushion to absorb price surprises.
This survey-based read cuts against spending-intention data from private-sector sources like Deloitte, whose August survey found that spending intentions held firm in both essentials and discretionary categories — something the firm itself read as a sign of resilience rather than strain. The gap between what people say they feel (sentiment, surveys) and what they actually do with their wallets (hard spending data) is a classic late-cycle pattern, and it’s worth taking neither reading off the table: the former tends to lead behavioral shifts; the latter confirms — or doesn’t — whether those shifts actually materialize.
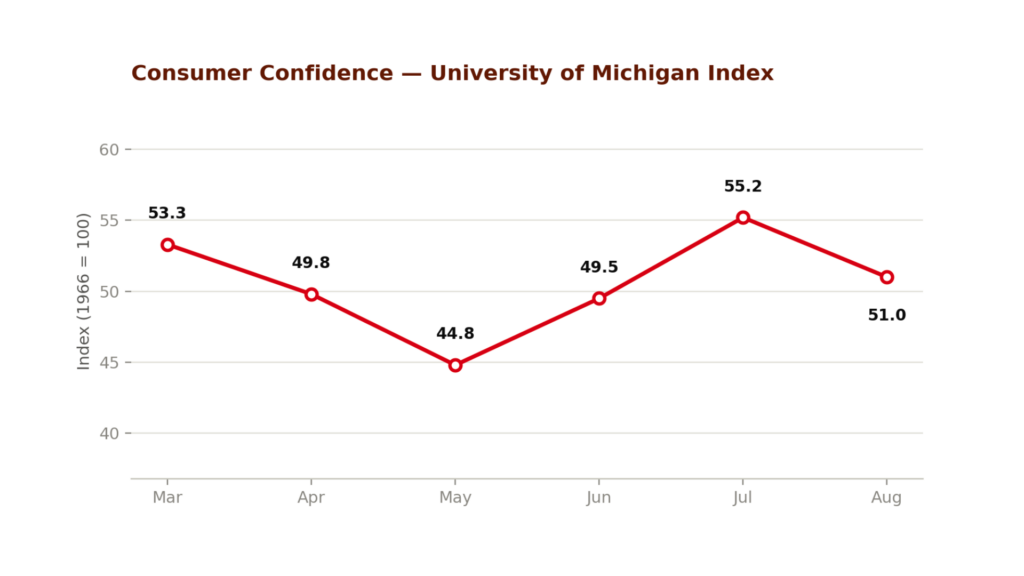
Exhibit 2. University of Michigan Consumer Sentiment Index, March–August 2026. Source: University of Michigan Surveys of Consumers (FRED, UMCSENT).
Corporate Earnings
This is where the picture flips entirely. Per the BEA, economy-wide corporate profits (the aggregate measure that’s part of the national accounts, not just publicly traded companies) rose $400.9 billion in the second quarter of 2026, well above the $74.4 billion increase in the first quarter. That’s a striking acceleration in the very quarter that real GDP decelerated to a 1.5% annualized pace, down from 2.1% in Q1.
On the equity side, S&P 500 earnings growth came in at 50.4% y/y in the second quarter — the highest since Q2 2021 — and the net profit margin hit 15.7%, a record for as long as comparable data has been tracked (since 2009). 86% of companies beat analyst estimates, well above the historical average of 76%–78%.
It’s worth popping the hood, though, before drawing conclusions. Much of that beat is concentrated: strip out the outsized investment gains at Alphabet and Amazon, and the earnings surprise percentage drops from 29.2% to 10.9%, while the net margin slips from 15.7% to 14.4%. The Communication Services sector — dominated by mega-cap tech — posted a 28.0% margin, well above its five-year average of 13.0%, while Health Care was the only sector to post an earnings decline, with a margin of just 6.3% (versus its 8.9% historical average). Ten of eleven sectors posted y/y growth, but the sheer size of the gains is skewed by a handful of companies tied to AI and compute investment.
Analyst estimates point to a gradual slowdown in earnings growth toward Q3 (27.4%) and Q4 (25.2%), with full-year 2026 growth landing around 30% and margins holding near 15% going forward. In other words, the market consensus already treats the current pace of growth as anything but the “new normal” — more a peak driven by favorable comps and one-off gains.
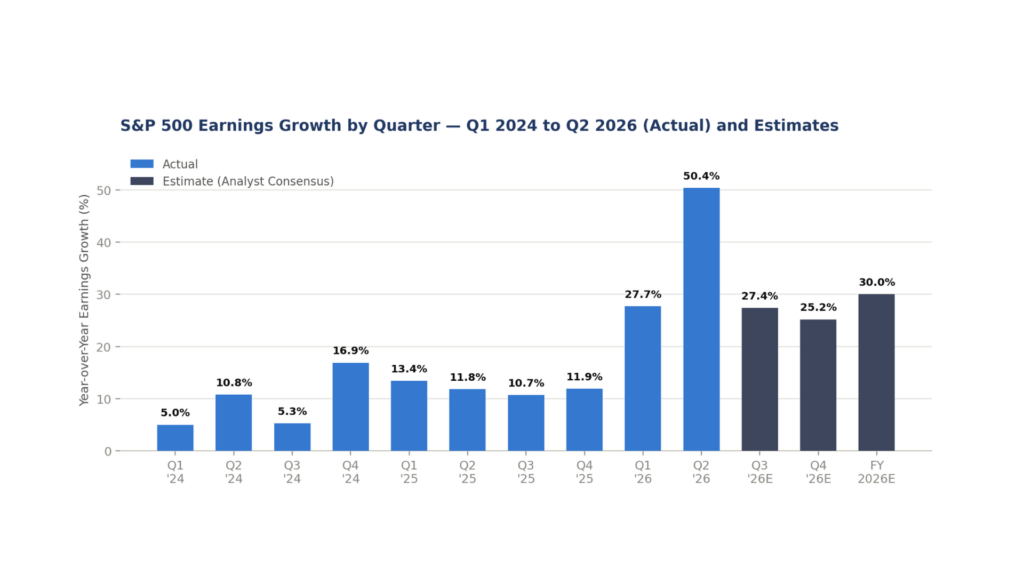
Exhibit 3. S&P 500 year-over-year earnings growth by quarter, Q1 2024–Q2 2026 (actual) and estimates for Q3 2026 through full-year 2026. Source: FactSet Insight, S&P 500 Earnings Season Update (editions from May 2024 to August 2026).
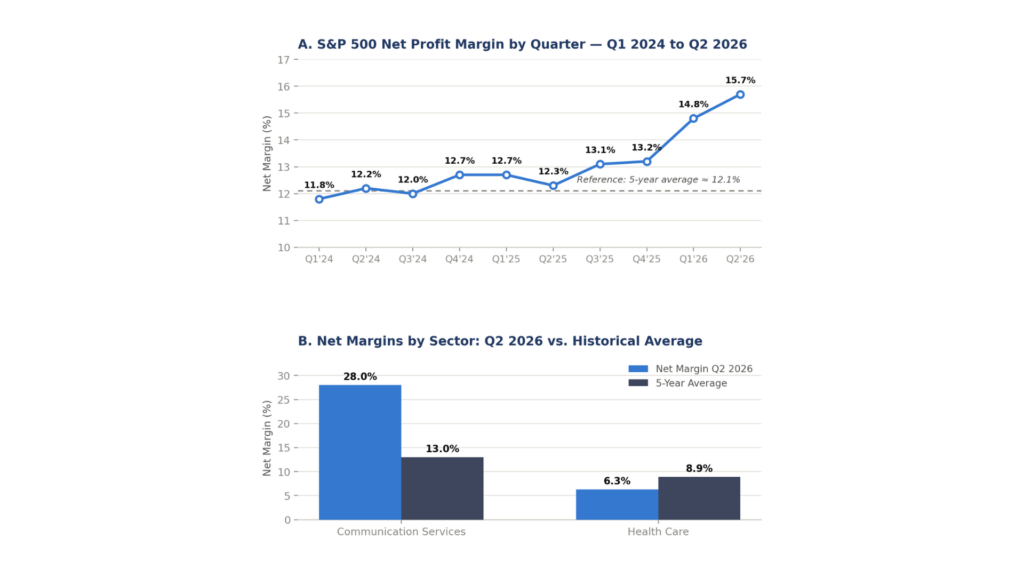
Exhibit 4. Panel A: S&P 500 net profit margin by quarter, Q1 2024–Q2 2026. Panel B: net margin by sector, Q2 2026 versus the five-year average. Source: FactSet Insight, S&P 500 Earnings Season Update and S&P 500 Reporting Highest Net Profit Margin in More Than 15 Years (2024–2026 editions).
Why the Divergence Is the Real Risk
Put side by side, these three data points tell the story of a “K-shaped” economy: a consumer spending with less conviction and a labor market that’s cooling off, coexisting with corporate profits and margins at all-time highs. That’s not necessarily a contradiction — companies can widen margins by cutting costs, automating, or benefiting from a thinner competitive field — but it is a warning sign for several concrete reasons.
First, concentration. Much of the jump in equity earnings traces back to a small handful of companies tied to AI investment and one-off financial gains, not to a broad-based improvement in corporate profitability. If that compute-capacity spend doesn’t deliver the returns the market is pricing in, the repricing could come fast — something the Federal Open Market Committee’s (FOMC) own July minutes flagged explicitly as a downside risk to asset valuations.
Second, margin sustainability. A 15.7% net margin for the S&P 500 is unprecedented over the last fifteen years. Historically, corporate margins tend to mean-revert once labor, input, or financing costs stop falling or start climbing again — a risk FOMC participants themselves flagged, citing tariff pressures and AI-related input costs weighing on corporate expenses.
Third, the consumer is, ultimately, the source of the revenue underwriting those profits today. If the deterioration in the labor market and consumer confidence eventually translates into weaker real spending — something retail sales and the drop in the furniture category already hint at — the slowdown would eventually work its way into corporate top lines, with a typical two-to-three-quarter lag between the “hard” consumption data and its showing up in earnings results.
The Fed, Caught Between Two Mandates
The Federal Reserve is facing this backdrop with its hands partly tied. At its July meeting, the FOMC held the fed funds rate at 3.50%–3.75% on a 9-3 vote, with the three dissenters pushing for a 25-basis-point hike on concern that inflation — headline PCE was running around 4.1% in May and core at 3.4% — stays elevated. Following the soft July jobs print, the market revised higher the odds that the Fed holds rates steady at its September meeting, though a minority view persists (among Bank of America economists, for instance) still calling for a hike before year-end, betting that inflation will keep outranking employment as the Fed’s priority.
This is, in essence, the classic central-bank dilemma in the face of mixed signals: cutting rates would help employment and the consumer but could reignite inflation that’s still running well above the 2% target; holding or hiking protects the inflation fight but puts more strain on a labor market that’s already cracking. The July minutes themselves flag the Middle East conflict and its impact on energy prices as an upside risk to inflation — a risk that, in fact, partly materialized in August, with gasoline topping $4 a gallon during the Michigan survey window and hitting consumer confidence directly.
What to Watch in the Months Ahead
For anyone tracking risk, there’s a fairly concrete set of data points and events to use as a reference. The August jobs report (BLS), due out in the first days of September, will be key to confirming whether July’s loss was a one-off or the start of a trend; the revisions to prior months, which have been consistently negative, deserve particular attention. The FOMC’s September rate decision will settle whether the Fed is prioritizing the labor market or inflation, and its statement should offer clues on how much weight geopolitical risk is carrying in that calculus.
Third-quarter earnings season will show whether earnings growth actually decelerates toward the projected 27%, and — more importantly — whether that slowdown is once again concentrated in a handful of names or broadens out. And August and September hard-spending data (PCE, retail sales) will let us test whether the drop in consumer sentiment finally shows up as weaker actual spending, or whether — as in August, per Deloitte — the consumer keeps spending despite saying they feel worse.
Risk Calendar: Upcoming Catalysts
| Event | When | Why It Matters |
| August jobs report (BLS) | Early September 2026 | Confirms whether July’s loss was a one-off or the start of a trend; watch for revisions to prior months |
| FOMC rate decision | September 2026 | Settles whether the Fed is prioritizing the labor market or the inflation fight |
| Third-quarter earnings season | October 2026 | Shows whether earnings growth decelerates toward the ~27% projected and whether it broadens beyond a handful of names |
| August–September PCE and retail sales | September–October 2026 | Tests whether the drop in consumer sentiment translates into weaker real spending |
This analysis is for informational and risk-monitoring purposes only; it does not constitute financial advice or an investment recommendation. Decisions on specific assets should be evaluated in light of individual risk tolerance and, where appropriate, with the guidance of a qualified financial advisor.
Sources
• U.S. Bureau of Labor Statistics (BLS), The Employment Situation — July 2026 — https://www.bls.gov/news.release/pdf/empsit.pdf
• U.S. Census Bureau, Advance Monthly Sales for Retail and Food Services, July 2026 — https://www.census.gov/retail/marts/www/marts_current.pdf
• U.S. Bureau of Economic Analysis (BEA), Personal Consumption Expenditures (PCE) — Consumer Spending — https://www.bea.gov/data/consumer-spending/main
• U.S. Bureau of Economic Analysis (BEA), GDP (Second Estimate) and Corporate Profits, 2nd Quarter 2026 — https://www.bea.gov/news/2026/gdp-second-estimate-and-corporate-profits-2nd-quarter-2026
• Federal Reserve, Minutes of the Federal Open Market Committee, July 28–29, 2026 — https://www.federalreserve.gov/monetarypolicy/fomcminutes20260729.htm
• FactSet Insight, S&P 500 Earnings Season Update: August 7, 2026 — https://insight.factset.com/sp-500-earnings-season-update-august-7-2026
• FactSet Insight, S&P 500 Reporting Highest Net Profit Margin in More Than 15 Years — https://insight.factset.com/sp-500-reporting-highest-net-profit-margin-in-more-than-15-years-2
• University of Michigan Surveys of Consumers, as reported by Yahoo Finance, U.S. Consumer Sentiment Falls in August — https://finance.yahoo.com/economy/articles/u-consumer-sentiment-falls-august-171815784.html
• Federal Reserve Bank of St. Louis (FRED), University of Michigan: Consumer Sentiment (UMCSENT) — https://fred.stlouisfed.org/series/UMCSENT
• CBS News, The Fed was expected to hike interest rates in September. Don’t bet on that now, economists say — https://www.cbsnews.com/news/federal-reserve-september-rate-decision-jobs-report-kevin-warsh/
• Deloitte, State of the US Consumer: August 2026 — https://www.deloitte.com/us/en/insights/topics/economy/consumer-pulse/state-of-the-us-consumer.html