Taking stock of the first half of 2026, and what comes next
August 2026 | Research paper for information purposes
Global banking has just delivered one of its best halves in recent memory… precisely when central banks lost the plot. In the pages that follow we walk you through, with figures, charts and a source at the foot of every claim, how we got here, what bankers themselves are quietly saying about credit, what the anatomy of spreads reveals about the price of risk, where we see the cracks almost nobody wants to look at and, above all, what to do with your portfolio in the second half of 2026.
To begin with: a tale of two speeds
If the first half of 2026 were a movie, it would feature two leading characters who cannot agree on the script. On one side, the banks: jubilant, posting record profits, with shares at all-time highs and regulators ready to loosen their belts. On the other, the real economy: a consumer splitting in two, inflation that bared its teeth again in the spring, and central banks that, for the first time in years, talk more about hiking than cutting.
That tension euphoric financial markets set against an increasingly murky macro backdrop, is the thread running through this edition of the Global Investment View. It is also, as we shall see, the key to positioning portfolios for the remainder of the year.
The question of the half is not whether banks did well. It is how much of that windfall is already priced in… and how much depends on nothing going wrong.
Let us take it step by step. First, the stage. Then, the players. And finally, what truly matters: the investment decisions.
The backdrop: Central Banks at a crossroads
The Federal Reserve
Anyone who hibernated through the winter would be in for a surprise. The Federal Reserve last cut its policy rate on Christmas Eve 2025, down to the 3.50%–3.75% range,1 and has not moved since: five consecutive holds, the latest on July 29. So far, nothing remarkable. What is remarkable is which way the internal debate now leans: in July, three committee members dissented in favor of a 25 basis point hike, and markets went as far as pricing roughly 77% odds of a September hike.2 Yes, you read that right: a hike, not a cut.
What changed? Inflation, which looked tamed, bared its teeth again. U.S. CPI climbed from 3.8% in April to 4.2% in May, a three-year high, and only eased back to 3.5% in June (with core at 2.6%) thanks to the U.S.–Iran ceasefire and the slump in gasoline prices.3 Behind the scare sit two forces nobody controls from a desk in Washington: tariffs, which keep bleeding through into goods prices, and oil, which flirted with 90 dollars a barrel, nearly 60% above where it started the year, on the back of Middle East tensions.4
Add to that a changing of the guard that is anything but minor: the Kevin Warsh Fed has made it clear it takes the 2% target seriously — dead seriously — even at the cost of cooling a labor market that is already showing hairline fractures: June’s payroll revisions slashed the three-month average by more than a third, and outside construction and healthcare, hiring has all but stalled.5
The result is an unusual cocktail: a Fed that cannot cut because of inflation and hesitates to hike because of jobs. For credit markets, that ambiguity is the new number-one risk factor.
The ECB
Across the Atlantic, the European Central Bank staged its own plot twist. On June 11 it delivered its first rate hike in nearly three years, taking the deposit facility to 2.25%, then paused in July to take stock. Euro area inflation cooled to 2.8% in June (core at 2.4%), but Christine Lagarde was unusually blunt: her projections only see a return to 2% by late 2027 — and only if policy turns more restrictive.6 Translation: Europe’s easing cycle is over, and what lies ahead is neutral-to-restrictive territory.
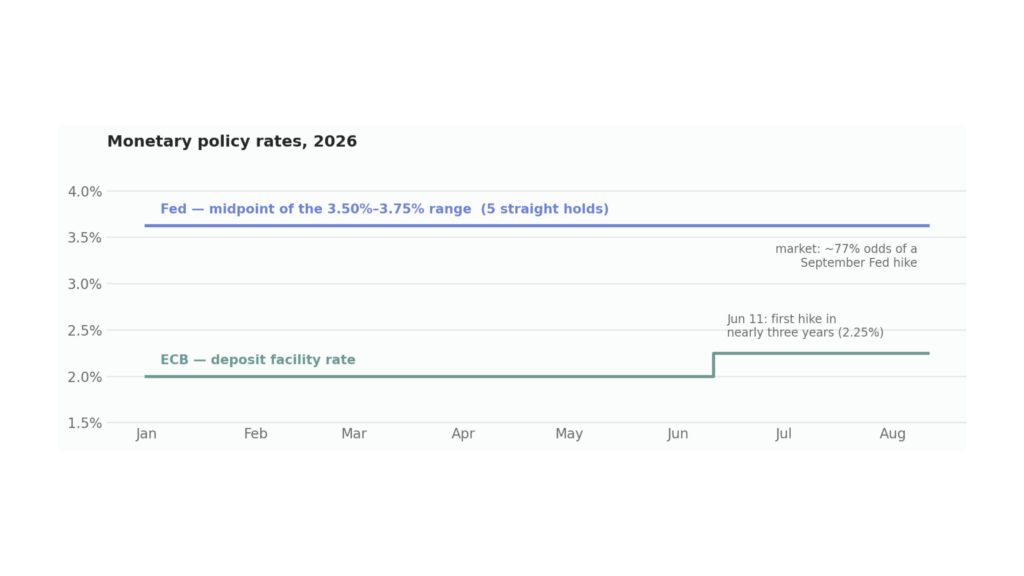
Chart 1. Monetary policy rates in 2026. Source: Federal Reserve, ECB, Trading Economics (as of August 11, 2026).
Energy is, once again, the shared villain. Both the Fed and the ECB are navigating the same dilemma: a supply shock that pushes inflation up and growth down at the same time. It is precisely the kind of environment in which rates and credit spreads can move together, and in the wrong direction, breaking the old diversification between duration and credit risk. Hold that thought: we will come back to it in the strategy section.
The banks
Now for the main characters. If the second-quarter earnings season had to be summed up in one line, it would be this: big U.S. banks did not just beat expectations; they blew past them. Aggregate earnings at the large U.S. banks rose roughly 40% year over year, with revenues up 20%. JPMorgan booked 21.2 billion dollars of net income — the largest quarterly profit in the history of American banking — on revenue of 58 billion (+27%). Goldman Sachs nearly doubled its earnings per share, to 20.98 dollars. Bank of America, Citi and Wells Fargo completed the sweep: all five majors beat the Street.
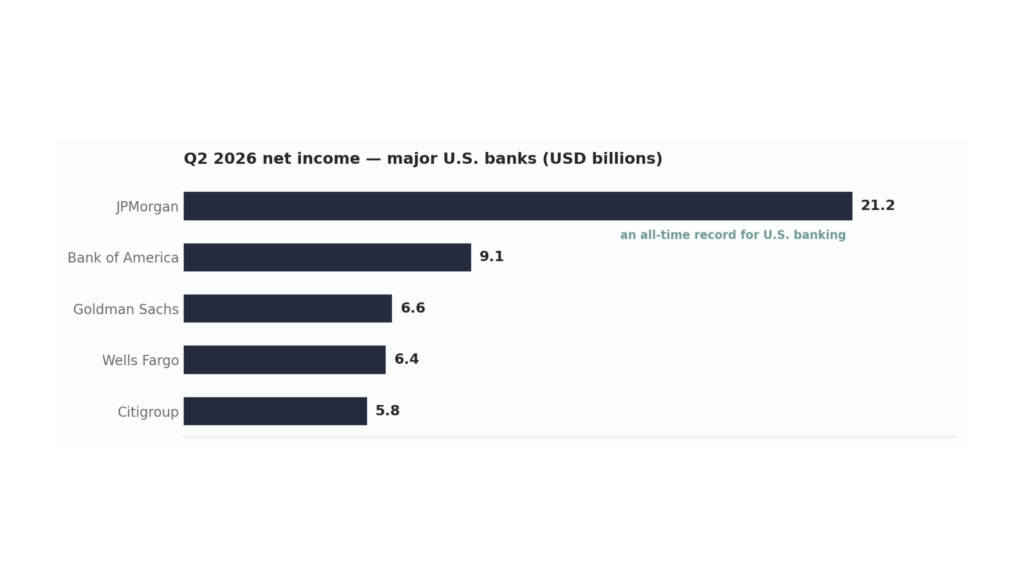
Chart 2. Q2 2026 net income at the five largest U.S. banks. Source: Q2 2026 corporate filings.
Table 1. Q2 2026 results — major U.S. banks
| Bank | Revenue (USD bn) | YoY change | Net income (USD bn) | EPS vs. consensus |
| JPMorgan | 58.0 | +27% | 21.2 (record) | 6.14 vs. 5.85 |
| Bank of America | 31.6 | +14.2% | 9.1 | 1.21 vs. 1.12 |
| Goldman Sachs | 20.3 | +39% | 6.6 | 20.98 vs. 14.47 |
| Citigroup | 24.8 | +14% | 5.8 | 3.15 vs. 2.73 |
| Wells Fargo | 22.6 | +9% | 6.4 | 2.00 vs. 1.72 |
Source: Q2 2026 corporate filings as compiled by TechTimes.
Where did all that money come from? From three engines worth telling apart, because not all of them are repeatable.
First, trading: geopolitical volatility and the mood swings around artificial intelligence sent markets revenues soaring (JPMorgan’s equities desk grew 86% and Goldman’s printed 7.4 billion, up 72%).10
Second, investment banking: fees climbed 30% to 55%, with M&A in full swing and a gift from the heavens: SpaceX’s June 11 listing, which raised 75 billion dollars — the largest IPO in history, dwarfing Saudi Aramco’s previous record (29.4 billion in 2019) — at a valuation of roughly 1.75 trillion dollars,11 and spread some 500 million in underwriting fees across the bulge bracket.12
Third, the dullest engine but the most valuable one: net interest income, which kept grinding higher (+9% at BofA, +5% at Wells Fargo) on stable deposit costs.13
Europe did not enjoy the same trading bonanza, but it brought in a solid harvest of its own: Santander lifted first-half underlying profit by 15% to 7.3 billion euros, and BBVA flexed a 22% ROTE alongside a fresh 2 billion buyback program.14 European banks, less geared to capital markets, leaned on the ECB’s rate hike and on loan books that — however timidly — returned to growth in key segments.15
U.S. banks trade at 1.75 times book value — levels last seen before the Global Financial Crisis. Europe’s banks, at a 30% discount to their American peers, remain the “on sale” version of the same phenomenon.
The regulatory tailwind
There is a third element behind the market’s optimism, and it transcends any single quarter: regulation. In 2026, the U.S. agencies (Fed, OCC and FDIC) tabled a rewrite of the capital framework — the famous “Basel Endgame”, take two — that points in one direction only: lighter requirements. The proposal consolidates the calculation into a single risk framework (ERBA), recalibrates the systemic-bank surcharge downward (roughly 23 billion dollars less in aggregate surcharges) and, by the agencies’ own estimates, would cut CET1 capital requirements by 4.8% to 7.8% depending on the bank’s category.16 Meanwhile, banks already sit on excess capital worth nearly 10% of their market capitalization after acing the stress tests, and shareholder payouts — dividends plus buybacks — are up around 50% year over year.17
For investors, the message cuts both ways. The friendly side: more lending capacity, more buybacks, more dealmaking. The uncomfortable side: the buffers that made banking the sturdiest sector of the post-2008 cycle are — quite deliberately — being thinned out just as the credit cycle grows old. It is not an alarm bell; it is a margin note you would do well not to erase.
The Credit tap: what lenders say behind closed doors
Earnings tell you what already happened. Loan officer surveys tell you what comes next. And here, the contrast between the two sides of the Atlantic is the story of the half.
United States
The Fed’s July SLOOS — the quarterly thermometer of whether banks are opening or closing the tap — painted a surprisingly relaxed picture. Standards on commercial and industrial loans were essentially unchanged, with demand firming among large and mid-sized firms. More striking still: significant shares of banks reported narrower spreads for their corporate clients — a telltale sign that competition to lend is alive and well. In commercial real estate, standards outright eased moderately. Even jumbo mortgages loosened a touch.18
The exception? Main Street. Credit cards were the only product where banks tightened terms, and demand for auto loans and mortgages weakened markedly.19 When banks fight tooth and nail to lend to big corporates while raising the bar on the average household, they are telling you where they see the risk. Take note.
Europe
The ECB’s bank lending survey, also out in July, showed the mirror image: a moderate net tightening of standards for firms (7% net, though less than the 19% feared), concentrated in the sectors most exposed to the energy shock — energy-intensive manufacturing and autos. For households, more of the same: 9% net tightening on housing and 12% on consumer credit, with net mortgage demand down 15%. The hidden good news: corporate loan demand edged up (+3%) when a slump was expected. The bad news: European banks expect to keep tightening into the third quarter.20
Table 2. The credit tap, side by side (July 2026 surveys)
| Segment | U.S. (SLOOS, Fed) | Euro area (BLS, ECB) |
| Firms | Standards unchanged; narrower spreads; demand firming (large and mid-sized) | Net tightening of 7% (19% feared); net demand +3% |
| Commercial real estate | Moderate easing of standards; demand stable | Caution in sectors exposed to the energy shock |
| Household mortgages | Standards steady (jumbos slightly looser); demand substantially weaker | Net tightening of 9%; net demand −15% |
| Consumer / cards | Modest tightening on cards; weaker auto demand | Net tightening of 12%; net demand −2% |
Source: Federal Reserve (SLOOS) and ECB (BLS), July 2026. European figures are net percentages of banks tightening (+) or easing (−).
In short: America lends eagerly to corporates and warily to families; Europe lends warily to almost everyone, but less warily than it feared. Credit is flowing, just ever more selectively.
Credit Markets
If the surveys speak for bank credit, spreads speak for market credit. And what they are saying is uncomfortable precisely because it sounds too good. The U.S. investment grade index spread closed the second quarter at 74 basis points, having ground 14 points tighter over the quarter. For perspective: that is the 1st percentile of the past twenty years.21 In plain English: over two decades, the market has almost never paid this little for taking corporate credit risk. High yield tells a similar story: spreads hovered around 290 basis points in October 2025 — near the 2007 all-time tight of 240 —22 and stood at 270 in early August 2026.23
Anatomy of the spread move: chronicle of a V-shaped half
It is worth pausing on how the price of risk actually traded, because the path tells you more than the snapshot. The half traced out a near-perfect V. In the first quarter, geopolitical stress — the U.S.–Iran escalation and the oil spike — pushed the investment grade spread 11 basis points wider, into the high-80s.24 In hindsight, it was a dress rehearsal for a crisis: it lasted weeks, not months. In the second quarter, with the ceasefire in place and a wall of yield-hungry money at work, the market did not just claw back the lost ground — it punched through its own lows, closing June at 74. High yield told the same story in miniature, and in real time, through July: from 267 on the 7th, it gapped to 287 on the 29th — as the Middle East flared up again — and was back at 270 within the first week of August.25 Twenty points of panic digested in seven sessions.
What does that resilience tell us? Two things, and they deserve to be kept apart.
The first is technical, and reassuring: there is so much money chasing yield — 202 billion dollars of inflows into taxable bond funds and 144 billion of foreign buying year to date through April —26 that every widening turns into a buying opportunity before it can become a trend. Fundamentals are pulling in the same direction: corporate earnings growing 29%, upgrades outpacing downgrades three to one, leverage stable.27
The second reading is structural, and far less kind: when spreads sit in the 1st percentile, the asymmetry is brutal. From 74 basis points, the room to tighten further is measured in single digits; the room to widen, in multiples of ten. Our arithmetic is simple: on an index with duration of roughly seven years, every 10 basis points of widening wipes out about six weeks of running income.28 Carry is generous by historical standards — all-in yields above 5%, the 74th percentile —29 but the cushion against an adverse move is thin.
A third nuance completes the picture: spread lows like these are not unprecedented. The 280–330 zone in high yield was visited in 2014, 2017, 2021 and 2024–2025, and in several of those episodes the market sat there for months — even years — without any accident materializing.30 Rich spreads are not, by themselves, a forecast of imminent widening; they are a statement of how little you get paid for being wrong. With the odds of a September Fed hike hovering near 77%,31 the geopolitical calendar wide open and the widest sector dispersion in years lurking beneath the index surface,32 we prefer to read today’s spreads as cheap insurance premium that the market is busy selling… and that we have no intention of selling alongside it.
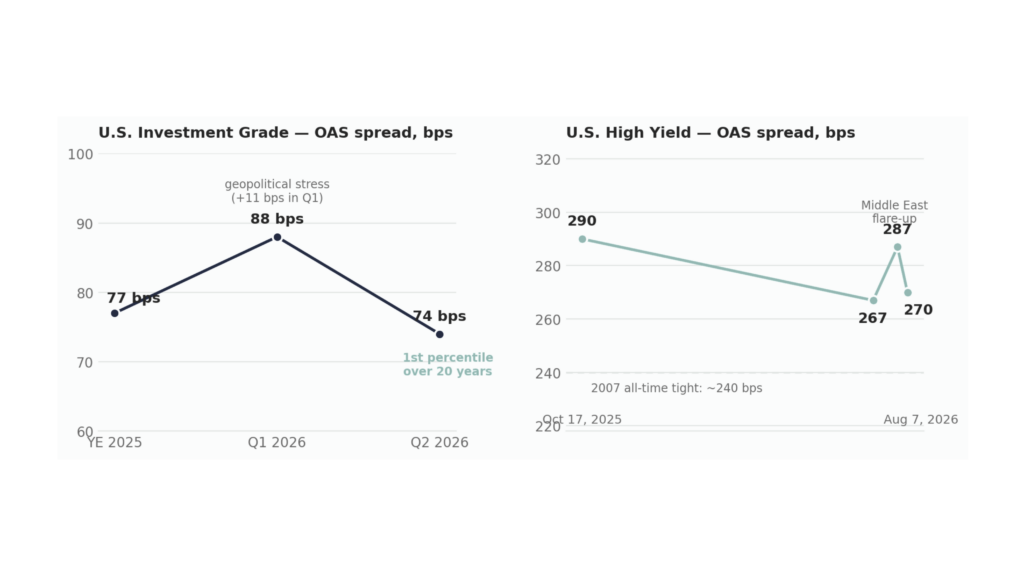
Chart 3. The V of the half: investment grade OAS by quarter (left) and July’s high yield episode (right). Source: Breckinridge, Schwab and Convex/ICE BofA.
Supply, meanwhile, is being absorbed without breaking a sweat: corporate bond issuance reached 605 billion dollars in the second quarter, up 42% from a year earlier, driven by refinancing and by the capex of the artificial intelligence boom. But — and it is a big “but” — beneath the index surface hides the widest sector dispersion in years: software under AI scrutiny, building materials punished by housing, energy hostage to geopolitics. Averages deceive. This is no longer a market for buying “the credit index”; it is a market for picking bonds the way one picks stocks.
The cracks: where the cycle is starting to show its age
Every mature credit cycle has its shadows, and this one is no exception. We flag three, in order of importance for our portfolios.
Private credit
Private credit grew into a 2 trillion dollar asset class in a decade without ever living through a full default cycle. That exam has now arrived. Fitch reported that the U.S. private credit default rate hit a record 6.0% in April, and the headline hides something worse: roughly two thirds of 2025 defaults were “distressed restructurings” — debt exchanges and maturity extensions negotiated under duress — which do not always show up in the friendlier statistics. Bank of America went as far as calling the asset class the lowest-quality corner of the entire leveraged finance universe.
Why should this matter to anyone who does not invest in private credit? Because the contagion channels are no longer theoretical. U.S. banks have built up close to 300 billion dollars of financing to private credit funds, BDCs and CLOs; the First Brands and Tricolor episodes left real losses behind (over 500 million at UBS, 715 million at Jefferies); and life insurers already allocate more than 10% of their assets to the asset class — more than 15% at the private equity-affiliated ones. The Financial Stability Board warned in May that direct and indirect bank exposure adds up to “at least hundreds of billions”. None of this announces an imminent crisis; all of it explains why regulators have stopped looking the other way.
The K-shaped consumer
The second crack is quieter, and more social: the U.S. consumer credit market is splitting in two. “Super prime” consumers — now 40.7% of the population, nearly four points more than before the pandemic — are being handed bigger credit lines and are paying on time. Meanwhile, 90-day card delinquencies have climbed to 2.53%, mortgage delinquencies have now risen for sixteen consecutive quarters year over year (with FHA loans accounting for nearly half of the arrears), and the debt-to-income burden of subprime segments is growing several times faster than that of the well-off. This spring’s tax refunds, analysts say, went straight into the gas tank. It is exactly what the SLOOS was hinting at: the banks know — which is why they are squeezing the cards while happily bankrolling the multinationals.
Commercial Real Estate: the wall that (almost) stopped being scary
The third shadow comes with a provisional happy ending. Some 875 billion dollars of commercial mortgages mature in 2026 — the largest refinancing wave in the sector’s history. Two years ago that number kept people up at night; today the market is digesting it with remarkable appetite: banks originated 455 billion of CRE loans in the first quarter alone (+80% year over year), CMBS issuance is running at a record clip and private credit is sitting on 585 billion of dry powder earmarked for the sector. Industrial, multifamily and data centers get financed without breaking stride. The exception is the usual suspect: non-prime office, where institutional credit simply does not reach and losses will keep surfacing drip by drip.
Table 3. Watchlist: the cracks in the cycle, by the numbers
| Indicator | Reading | Our take |
| Private credit default rate (Fitch) | 6.0% (record, Apr-26) | First real test of a USD 2 trillion market |
| Bank credit to private funds, BDCs and CLOs | ~USD 300bn | The contagion channel into banking is no longer theoretical |
| 90+ day card delinquencies (U.S.) | 2.53% | The weak link is the non-prime consumer |
| Mortgage delinquencies (60+ days) | 16 quarters rising | Gradual deterioration, concentrated in FHA |
| 2026 CRE maturities | ~USD 875bn | Digestible — except non-prime office |
| IG spread (OAS) | 74 bps (1st percentile in 20 years) | Minimal cushion against surprises |
Source: Fitch/Forbes, TransUnion, HB Capital and Breckinridge.
Our investment view for the second half
Now for what matters: what to actually do with the portfolio. Our entire strategy fits in one line: “clip the carry, don’t chase the squeeze”. In plain English: quality bonds still pay an attractive annual income — that periodic income is the “carry” — and collecting it is, today, the reason to own them. What they no longer offer is upside from price appreciation, because prices are already at their richest; betting on them getting even richer (“chasing the squeeze” in spreads) is a risk that does not pay. In practice, this idea translates into five concrete decisions:
- 1. Investment grade bonds: own a little more than usual, sticking to solid issuers. Why own them? Because they pay yields above 5% a year,42 attractive in its own right. What not to expect from them? Price gains: their spreads sit at their richest level of the past twenty years. The goal is the income, not capital appreciation. Hence our preference for strong balance sheets and intermediate maturities — accepting a “boring” investment in exchange for peace of mind.
- 2. High yield and leveraged loans: invest only on a name-by-name basis. Sectors are behaving in very different ways — the widest divergence in years —,43 so buying “the whole index” mixes the good in with the bad. We want only the situations where the market has punished harder than fundamentals have actually deteriorated (building materials, certain services). In leveraged loans, the extra yield now on offer already compensates for their weaker covenant protections.44
- 3. Bank equities: stay positive, preferring European banks over U.S. ones. The sector combines record earnings, excess capital, a regulatory tailwind and growing dividends and buybacks.45 The difference lies in the entry price: U.S. banks trade at 1.75 times book value — expensive — while European banks offer similarly high returns at a 30% discount.46 Same business, bought cheaper.
- 4. Private credit and low-quality consumer debt: do not add exposure. These are the two corners where the cycle is already showing real damage: record defaults in private credit47 and rising delinquencies among lower-income households.48 This is not about panic-selling; it is about not adding new positions without first digging into each fund, the quality of its loan book and the way it marks its assets.
- 5. Maturities: favor intermediate — not long — maturities, and keep cash on hand. Normally the long bond protects a portfolio when turbulence hits. But when the shock comes from the supply side (oil, tariffs), inflation pushes rates up and fear pushes spreads wider at the same time — and the long bond loses twice over.49 Hence our preference for intermediate maturities and ready liquidity: if September brings a scare, we want to be buyers, not forced sellers.
The risks we are watching closely
No base case survives contact with reality intact, so it is worth putting on record what could bend ours.
First, and most obvious: energy-driven inflation. Crude back at 90 dollars — or beyond — on any Middle East relapse would reopen the hiking debate at the Fed and the ECB simultaneously.50
Second: a September Fed hike51 that credit markets, lulled by the long pause, have not yet fully digested; with spreads at the tights, the margin for error is razor-thin.
Third: a private credit accident with a name big enough to reach the banking system through those 300 billion dollars of financing.52
Fourth: the non-prime consumer, whose deterioration is gradual until it isn’t — consumer cycles tend to snap at the weakest link.53
And fifth, cutting across all of the above: complacency. When the price of risk sits at twenty-year lows, the most expensive risk of all is assuming nothing can go wrong.
In closing: no autopilot on this leg
The first half of 2026 left behind a delicious paradox: banking is enjoying its brightest moment in nearly two decades just as the monetary map turned blurrier. The record profits, the razor-tight spreads and the regulatory relief are all real, and fighting them has been, and may well remain, expensive. But markets do not pay you for describing the present; they pay you for anticipating change. And the signals of change are there, quiet but consistent: banks tightening card standards while tripping over each other to lend to multinationals, record defaults in the least transparent corner of credit, and central banks debating hikes where a year ago the market was pricing cuts.
Our bottom-line recommendation is almost artisanal: harvest the income the market still offers so generously, pick every exposure with the discipline of a market that no longer forgives mistakes, and keep the liquidity, and the humility, to seize the moments when the price of risk becomes interesting again.

VenQuest Group will keep monitoring every one of these variables and sharing with you, in every issue, not just what we see, but what we would do about it.
Until the next issue.
Important notice
This document was prepared by VenQuest Group for information purposes only and does not constitute investment, legal or tax advice, nor an offer or recommendation to buy or sell any security. Figures are drawn from the public sources cited in the footnotes, as of August 2026; no representation is made as to their accuracy or continued validity. The views expressed herein may change without notice. Past performance is no guarantee of future results. Please consult your financial advisor before making any investment decision.