A two-act story on what the first half of 2026 left behind in the race between bricks and private credit, told without the Bloomberg-terminal jargon.
VenQuest Research Takeaway
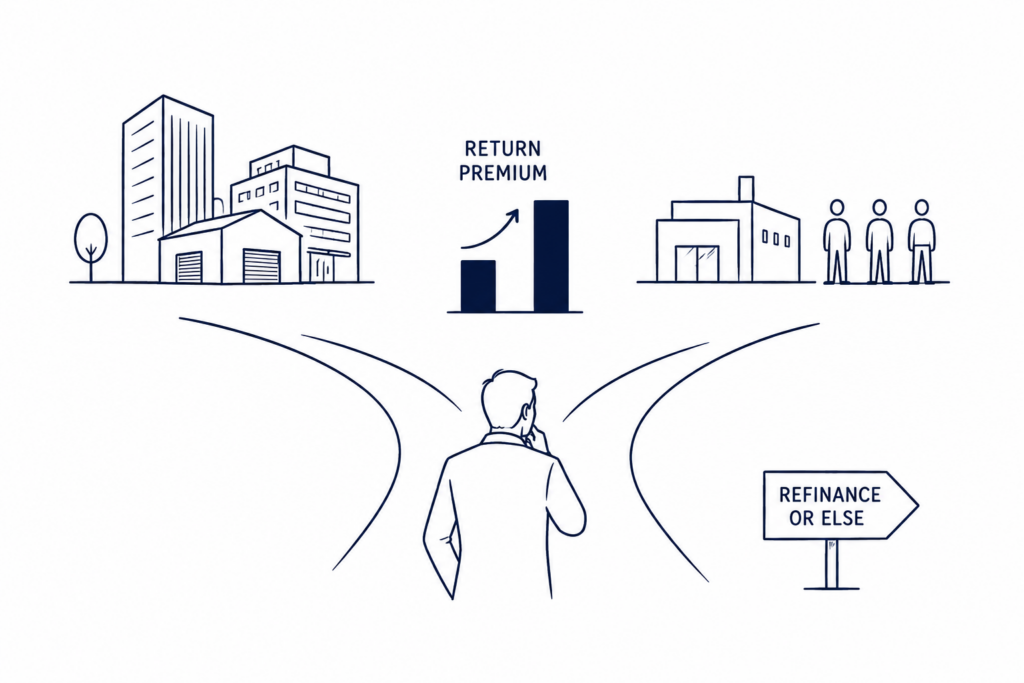
Picture this: eighteen months ago, you had two friends pitching you on where to put your money. The first one bought buildings, offices, warehouses, shopping centers. The second one lent money straight to mid-sized companies, no bank in the middle. Your lender friend promised you, and delivered, a noticeably fatter return than your building friend. That gap is what the industry calls the “return premium,” and it’s what this Sector Deep Dive digs into.
Here’s the good news, right out of the gate: the premium is still alive and kicking, and it’s still generous. The headline worth digging into is that, over the first half of 2026, it started showing cracks, not in the big number everyone eyeballs first, but in what’s sitting underneath it. On the private credit side, warning signs began cropping up that part of what gets booked as profit isn’t cash that actually hit the till, but rather payment promises kicked down the road, and that some investors are already asking for their money back ahead of schedule. On the buildings side, the opposite played out: after two rough years, a real recovery started taking hold, propped up by rents that are climbing, not by pipe-dream valuations. Throw in a mountain of real estate debt, nearly a trillion dollars, coming due this year that somebody has to refinance, and you’ve got the heart of this story.

VenQuest Research’s institutional bottom line: the return premium private credit commands over real estate is still real, but it no longer comes free of charge. Picking well, the manager, the sector, the timing, matters more today than it did two years ago.
Before We Dive In: Meet the Cast of This Story
Like any good story, it pays to introduce the characters before the action kicks off. On the buildings side, the protagonist is institutional real estate: the big pension funds, insurers, and managers who buy whole commercial properties outright, not shares in a company that owns them. Their performance gets tracked by the NPI, short for NCREIF Property Index: a benchmark that works out, quarter by quarter, how much a basket of more than thirteen thousand properties gained or lost. It’s put together by NCREIF (the National Council of Real Estate Investment Fiduciaries), the trade group that brings together those big institutional real estate investors across the United States (Connect CRE, 2026). A close cousin of the NPI is the ODCE (Open-End Diversified Core Equity), an index that tracks the more conservative, liquid end of private real estate funds (Connect CRE, 2026).
If you’d rather invest in real estate without signing up to buy an entire building, there’s a publicly traded version: REITs (Real Estate Investment Trusts), companies that own property whose shares trade back and forth just like any listed stock. Their performance is tracked closely by Nareit (the National Association of Real Estate Investment Trusts), the industry association that publishes the FTSE Nareit All Equity index (Nareit, 2026).
On the other side of the story sits private credit, specifically direct lending: funds that lend straight to mid-sized companies (the so-called middle market) with no bank stepping in between. Its benchmark is the CDLI (Cliffwater Direct Lending Index), which tracks thousands of these loans and measures their return (Cliffwater, 2026). Plenty of high-net-worth investors tap into this asset class through BDCs (Business Development Companies), investment vehicles built to funnel their capital into these loans (CAIA, 2026).
There’s one technical term that will keep popping up, so let’s get it out of the way now: PIK (Payment-in-Kind), a way of paying interest where, instead of cash landing in the lender’s pocket, the balance owed simply grows bigger — a sort of “pay me later, with interest tacked onto the interest” (Cliffwater, 2026; CAIA, 2026).
And like every money story, this one has a central bank humming in the background: the U.S. Federal Reserve (the Fed), whose rate decisions shape both the cost of financing a building and the payout on a private loan. The benchmark rate behind nearly every floating-rate loan in the country is called SOFR (Secured Overnight Financing Rate), and when you hear that a loan is priced at “SOFR plus 370 basis points,” a basis point is simply one-hundredth of a percentage point: 100 basis points equal 1% (Capstone Partners, 2026; PrimeRates, 2026).
Last but not least, a handful of terms we’ll keep leaning on: CRE (Commercial Real Estate — offices, warehouses, hotels, shopping centers, as opposed to residential housing); NOI (Net Operating Income, what’s left over from running a building after operating costs, before debt and taxes get taken out); FFO (Funds From Operations, REITs’ favorite profit yardstick, truer to real cash flow than plain old accounting profit); and LBO (Leveraged Buyout, buying a company mostly with borrowed money) (Nareit, 2026; Capstone Partners, 2026).
The Story So Far, for Those in a Hurry
- First, the good news on buildings: the NPI — the institutional real estate index you just met — posted a 1.29% return in the second quarter of 2026, the best four-quarter rolling result since 2022, with 1.17 points coming from real rental income and only 0.12 from appreciation (Connect CRE, 2026).
- Meanwhile, private credit kept paying out more: the CDLI closed out 2025 with a 9.3% return, and over the past twenty years it has averaged 9.5% a year, with only one year in the red — 2008 — across its entire history (Cliffwater, 2026).
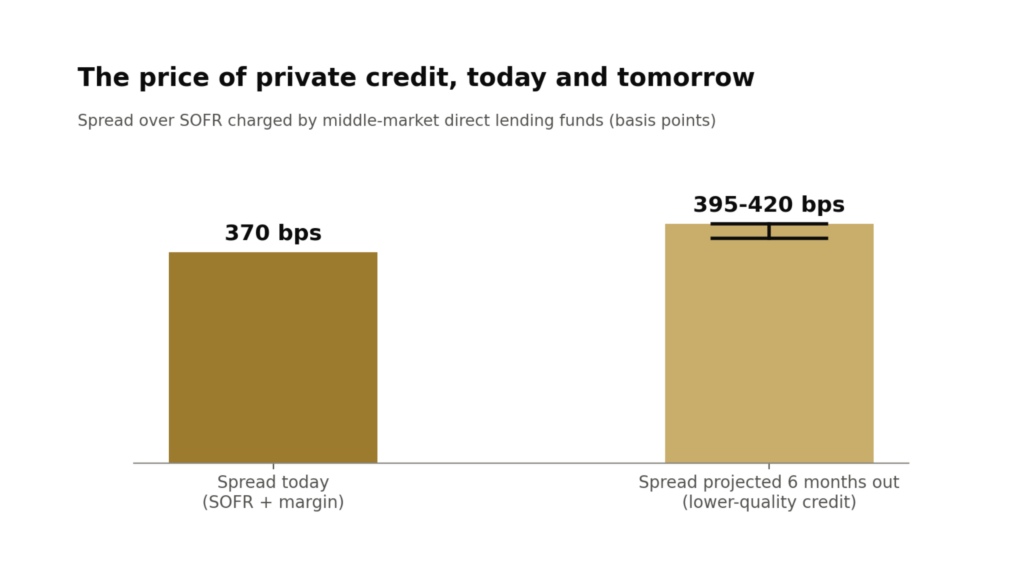
- But here’s the first plot twist: the margin private credit funds charge on top of SOFR is holding around 370 basis points, and the market itself already expects it to widen out by 25 to 50 basis points over the next six months for lower-quality credits — risk is starting to get priced in before trouble even shows up (Capstone Partners, 2026).
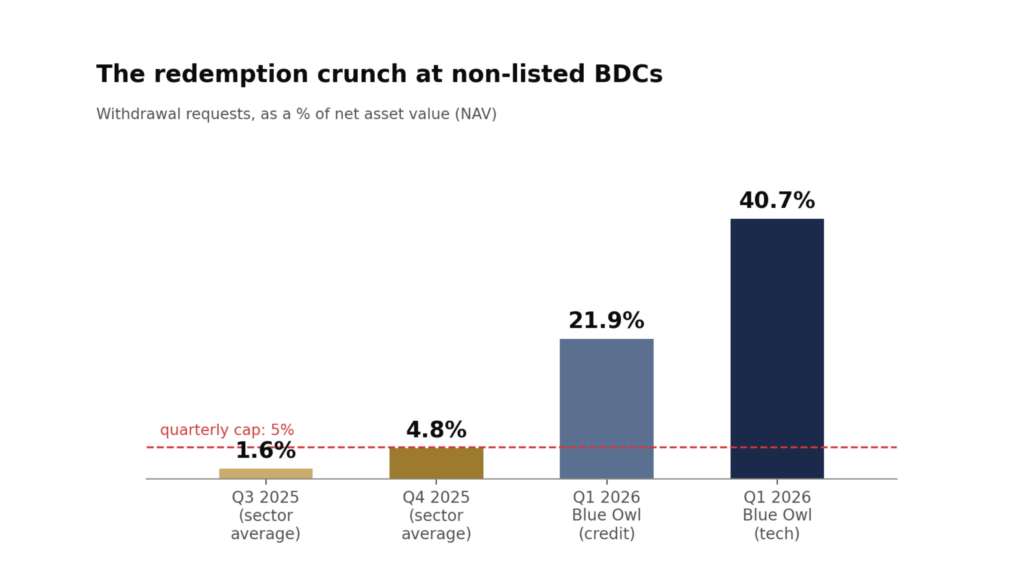
- Second plot twist, and a more unsettling one: investors who had parked money in BDCs started asking for it back in unusual amounts. Redemption requests climbed from 1.6% in the third quarter of 2025 to 4.8% in the fourth, and by the first quarter of 2026, Blue Owl’s tech-focused vehicles were fielding withdrawal requests as high as 40.7% of their value, versus 21.9% at its credit income funds (CAIA, 2026).
- On the buildings side, close to a trillion dollars — US$936 billion, to be exact — in commercial real estate debt comes due in 2026, 19% more than the 2025 estimate, and refinancing that debt now runs 6.24% on average, versus the 4.76% the old debt was paying (CRE Daily, 2026).
- On the stock market, REITs turned in a standout half: they handed back 14.9%, beating the large-cap Russell 1000 index by 4.6 percentage points — a complete about-face from 2025, when the exact opposite played out (Nareit, 2026).
- And in the background, the Federal Reserve held its benchmark rate between 3.50% and 3.75%, with the market split between banking on one more cut before year-end and the — far from negligible, 30% to 40% odds — chance that there’s no cut at all in 2026 (PrimeRates, 2026).
The Plot Twist
For years, this story carried a simple moral, almost straight out of a personal-finance textbook: private credit pays more because you can’t pull your money out whenever you feel like it, and because it bankrolls more heavily indebted companies; real estate pays less, but it shields you from inflation and gives you something tangible — a building — standing behind your investment. That moral still holds up, in essence. What changed in the first half of 2026 is which way each one is heading. Buildings are on the upswing: more real rental income, appreciation adding back to the total, purchase prices starting to climb again. Private credit, on the other hand, is starting to show cracks that don’t show up in the index’s headline number, but in its internal makeup: more payments kicked down the road instead of cash in hand, more investors heading for the exits, and a hefty concentration in one sector — subscription-based software, known as SaaS (Software as a Service) — whose future artificial intelligence itself is starting to call into question (CAIA, 2026).
The question that actually matters isn’t whether private credit still out-earns real estate — it does, and by a healthy margin — but whether that extra margin still makes up for the real risk these funds are taking on today, or whether it simply reflects a stretch when more companies were lining up to borrow than funds were willing to lend with discipline.
VenQuest Research’s read is that we’re looking at a normalization, not a reversal: private credit is going to keep being, on paper, the highest-paying piece of an illiquid portfolio. But the room for error in picking wrong — the wrong fund, the wrong sector — has shrunk noticeably compared with what we were seeing in 2023 and 2024.
How Big Are We Talking?
To size up this story, it helps to line the numbers up side by side. The universe NCREIF tracks — those big institutional real estate investors — adds up to 13,160 properties worth US$943 billion (Connect CRE, 2026). Private credit, meanwhile, now runs in a global market estimated at US$2.02 trillion, of which the CDLI covers roughly 21,000 loans worth US$549 billion (CAIA, 2026; Cliffwater, 2026). And there’s one figure that ties both protagonists of this story together: the US$936 billion in commercial real estate debt coming due in 2026, a growing chunk of which traditional banks are no longer the ones refinancing — real estate-focused private credit funds are stepping in instead (CRE Daily, 2026). Put another way: real estate and private credit have stopped being two separate worlds and started merging, right in the business of financing buildings.
Chapter 1: Bricks Make a Comeback
What the Institutional Numbers Say
Let’s start with the institutional world pension funds and insurers.
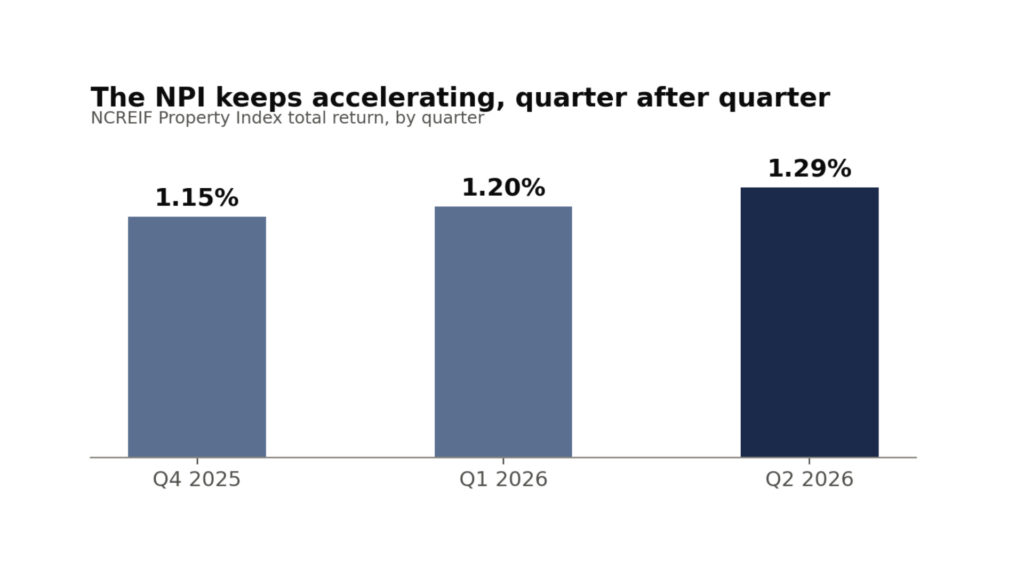
The NPI closed out the first quarter of 2026 with a 1.2% quarter-on-quarter return, just a notch above the 1.15% booked in the fourth quarter of 2025 (Capital Economics, 2026), then stepped up to 1.29% in the second quarter — the best four-quarter rolling result since late 2022 (Connect CRE, 2026). The breakdown is what matters: of those 1.29 points, 1.17 came from real rental income — cash that actually hit the till — and only 0.12 from building appreciation (Connect CRE, 2026). It’s a quiet recovery, propped up by cash flow rather than speculation, which makes for sturdier footing going forward. Its sister index, the ODCE, posted a 1.25% return in the first quarter, in line with the NPI (Connect CRE, 2026). And here’s a curious data point worth filing away: senior housing turned in a 3.9% quarterly return in the first quarter, with strong value growth — a sign that demographic demand keeps rewarding the less-traditional sectors over classic office space or the shopping mall (Capital Economics, 2026).
Source: Capital Economics (2026); Connect CRE (2026).
What the Stock Market Says
If we’d rather look at the publicly traded version, the picture is even more eye-catching.
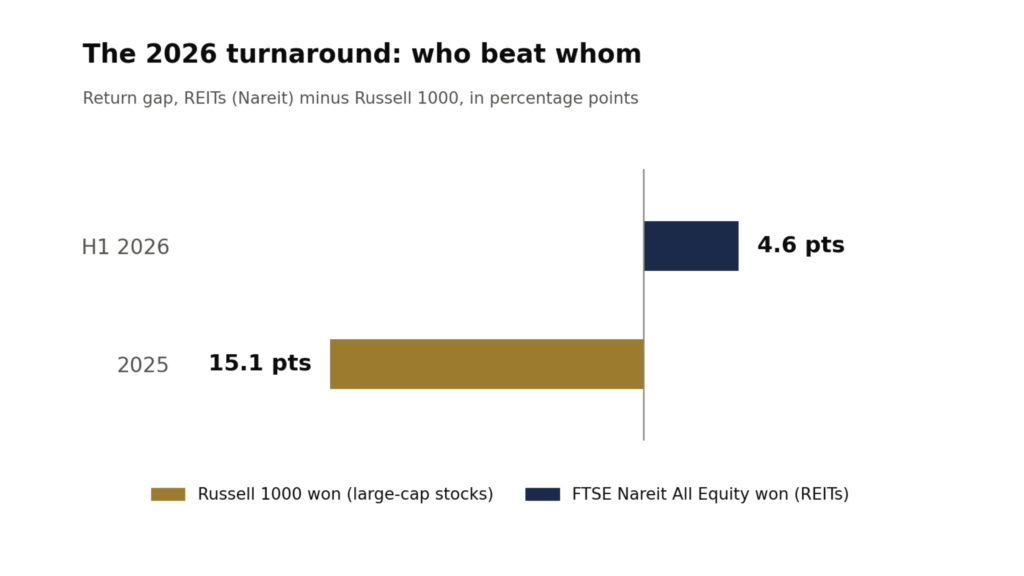
The FTSE Nareit All Equity REITs index handed back 14.9% in the first half of 2026, beating the large-cap Russell 1000 index (10.3%) by 4.6 percentage points — a full reversal from 2025, when the Russell 1000 had beaten REITs by 15.1 points (Nareit, 2026). One clear star stood out within that story: the lodging and resorts sector climbed 42.8%, while timberland, gaming, and telecom barely cleared 3% (Nareit, 2026). And this wasn’t just a stock-price party: FFO growth hit 14.8% year over year in the first quarter, with NOI up 5.6% and same-store NOI up 3.8% (Nareit, 2026). There’s real business behind the improvement, not just optimism.
Source: Nareit (2026).
The Cost of Money and the Debt Wall Ahead
Now, the counterweight to this upbeat story.
Now, the counterweight to this upbeat story.
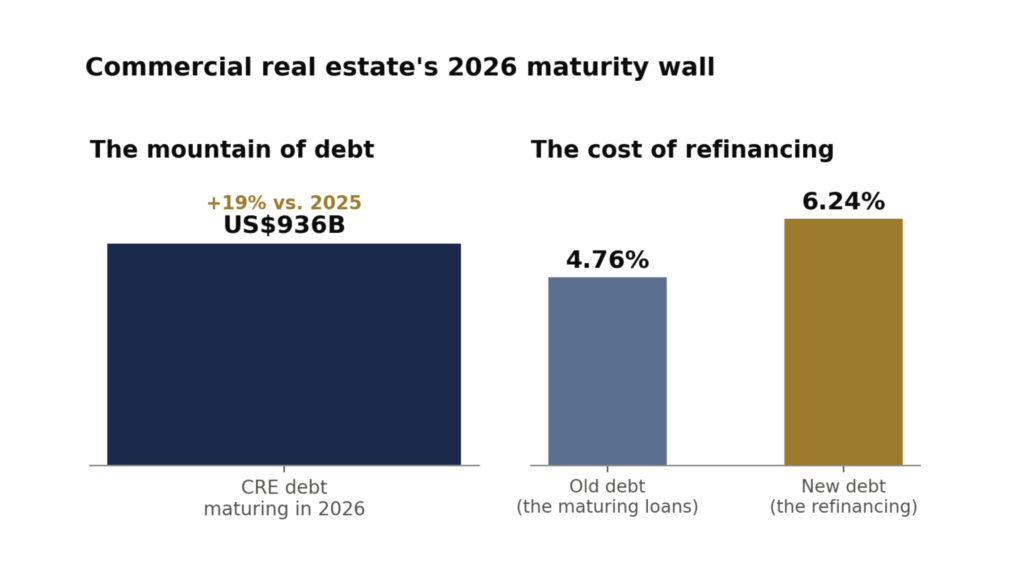
CBRE, one of the world’s largest real estate advisory firms, projects a 16% jump in commercial real estate investment volume for 2026 and expects cap rates — the return the market demands for buying a building, which move in the opposite direction from price — to tighten by 5 to 15 basis points across most property types (CBRE, 2026). But there’s a mountain of debt to climb over first: US$936 billion in commercial real estate loans come due in 2026, 19% more than the 2025 estimate, and refinancing that debt now costs 6.24% on average, versus the 4.76% the maturing debt was paying (CRE Daily, 2026).
Delinquency is holding at a relatively tame 1.52% as of the second quarter of 2025, but largely because banks have chosen to extend terms on troubled loans rather than force a resolution — a practice that kicks the can down the road rather than solving anything (CRE Daily, 2026). Traditional banks, which still hold roughly 60% of those near-term maturities, keep pulling back their exposure, and that’s exactly where real estate-focused private credit finds its clearest shot today at originating new loans (CRE Daily, 2026).
Source: CRE Daily (2026).
Chapter 2: Cracks Beneath Private Credit’s Shine
The Number Everyone Watches: the CDLI
Private credit’s benchmark, the CDLI, closed out calendar year 2025 with a 9.3% total return: 10.4 points came from interest income, and just 0.7 points from that PIK we already walked through — the deferred payment that inflates the loan balance instead of putting cash in the lender’s pocket (Cliffwater, 2026). Over a twenty-year stretch, from 2004 through 2025, the CDLI has averaged 9.5% a year, with only one year in the red: 2008 (Cliffwater, 2026). On paper, it’s one of the most consistent resilience stories in modern finance.
What It Costs to Lend Money Today
But lending money comes at a price too, and that price is starting to shift. In the middle market — the mid-sized-company segment direct lending targets — the margin funds charge on top of SOFR is holding around 370 basis points, with 84.4% of new leveraged buyout (LBO) deals pricing that margin below 550 basis points (Capstone Partners, 2026). The volume of institutionally originated leveraged loans dropped 22.5% year over year in the first quarter of 2026, a sign that lenders are getting choosier — they’ve already started tightening terms for energy-hungry industries and for software companies directly exposed to AI disruption (Capstone Partners, 2026). And the market itself already expects that margin to climb 25 to 50 basis points over the next six months, especially for lower-quality credits (Capstone Partners, 2026): the price of risk is adjusting before trouble shows up, not after.
Source: Capstone Partners (2026).
What Doesn’t Meet the Eye
This is where the story really gets interesting. The most talked-about data point of the half doesn’t show up in the index return, it shows up in how investors themselves are behaving. Non-listed BDCs, those vehicles we introduced earlier, saw redemption requests climb from 1.6% of their value in the third quarter of 2025 to 4.8% in the fourth, with five of these vehicles blowing past the 5% quarterly redemption cap they’d set for themselves (CAIA, 2026). Some tech-heavy products fielded withdrawal requests as high as 40.7% of their value, and so-called “credit income” funds as high as 21.9%, a signal that, so far, looks more like investor jitters than any real deterioration in the underlying portfolios (CAIA, 2026).
Source: Chartered Alternative Investment Analyst Association, CAIA (2026).
The default rate sits at roughly 2% today, in line with the historical average, but investment bank Morgan Stanley projects it could climb as high as 8% if AI disruption to subscription-software business models deepens — and today roughly 26% of direct lending portfolios are exposed to exactly that sector, which went from US$8 billion in loans in 2015 to US$500 billion by the end of 2025 (CAIA, 2026).
On top of that, roughly 70% of private credit loans lack robust covenants — those early-warning clauses that flag for the lender when something’s starting to go sideways — and “problem” deferred interest hit 6.4% of loans in the fourth quarter of 2025, nearly triple the 2021 level (CAIA, 2026).
At a Glance: The Scorecard
| At a glance | Real Estate (buildings) | Private Credit (direct loans) |
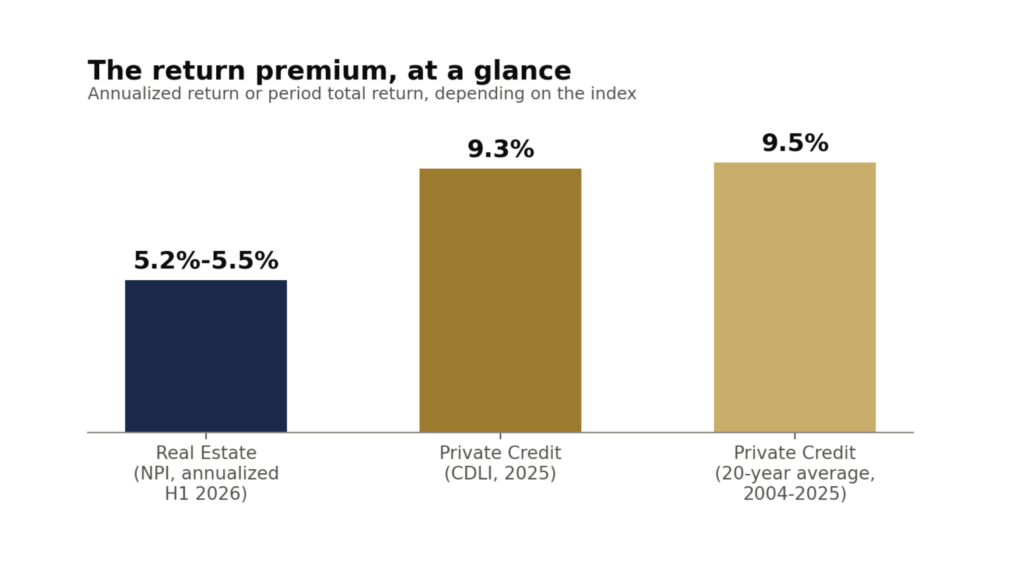
| What it paid | NPI, Q2 2026: 1.29% for the quarter (≈5.2%–5.5% annualized) (Connect CRE, 2026) | CDLI, full-year 2025: 9.3% total return (Cliffwater, 2026) |
| Track record | 13,160 properties · US$943 billion in value (Connect CRE, 2026) | 9.5% average annual return, 2004–2025, with just one year in the red: 2008 (Cliffwater, 2026) |
| The price of risk | Expected to tighten by 5 to 15 basis points in 2026 (CBRE, 2026) | ~370 basis points over SOFR; the market expects it to widen out another 25–50 basis points (Capstone Partners, 2026) |
| The warning sign | US$936 billion in debt comes due in 2026, 19% more than in 2025 (CRE Daily, 2026) | BDC redemptions jumped from 1.6% to 4.8% of value in a single quarter; defaults could climb from 2% to 8% (CAIA, 2026) |
Source: Connect CRE (2026); Capital Economics (2026); Cliffwater (2026).
The Climax: Is Paying Up for Private Credit Still Worth It?
Let’s set the two numbers side by side, like two possible endings to the same story. Institutional real estate annualizes at 5.2% to 5.5%, with real rental income doing almost all the heavy lifting and only a whiff of appreciation (Connect CRE, 2026; Capital Economics, 2026). Private credit closes out 2025 at 9.3% — practically double (Cliffwater, 2026). That gap — the premium this document is named for — is still, in pure arithmetic, one of the widest of recent cycles. But the CDLI figure still doesn’t fully account for the cost of two trends already underway: the rise in deferred payments, which books accounting gains without real cash coming in, and the concentration in one sector — software — whose growth story faces more doubt today than it did eighteen months ago (CAIA, 2026). On the other side, real estate is telling a story of improving return quality: more real rental income, cap rates starting to tighten, and publicly traded REITs already pricing in that optimism with a 14.9% return for the half (Nareit, 2026; CBRE, 2026).
The trade press has already started running headlines calling this moment a possible capital rotation, with money flowing out of private credit and into real estate (CNBC, 2026). VenQuest Research doesn’t buy the abrupt-pivot reading: private credit’s underlying edge — floating rates, senior claims on collateral, control over the borrower — remains real and defensible. What is happening, and this is the conclusion that actually matters, is a gradual convergence: real estate is getting cheaper relative to the risk it carries, and a slice of private credit is getting pricier relative to the risk it’s hiding.
What’s driving this story forward
- Traditional banks pulling back, the quiet protagonist: banks still hold roughly 60% of near-term real estate debt maturities, but they keep scaling down exposure for regulatory reasons, opening up a permanent — not just temporary — lane for real estate-focused private credit funds (CRE Daily, 2026).
- A Fed taking its sweet time: with the benchmark rate between 3.50% and 3.75%, and much of the market not banking on more than one cut all through 2026, private credit keeps pulling in attractive nominal interest, while leveraged real estate keeps feeling the sting of refinancing old debt at higher rates (PrimeRates, 2026).
- A real estate recovery built on real business, not wishful thinking: NOI growth (5.6%) and FFO growth (14.8%) recorded in the first quarter of 2026 suggest the improvement is coming from higher occupancy and higher rents, not from buildings simply coming back into fashion (Nareit, 2026).
- Demand that doesn’t hinge on the rate cycle: sectors like senior housing, hotels and resorts, and assets tied to digital infrastructure keep pulling in capital for demographic and structural reasons that go well beyond whatever the Fed does next quarter (Capital Economics, 2026; Nareit, 2026).
- Capital still on standby in private credit: despite all the noise around retail-vehicle redemptions, closed-end institutional funds — the ones that don’t promise quarterly liquidity — still have committed capital sitting ready to lend to anyone who fits a disciplined underwriting bar (CAIA, 2026).
The red flags worth keeping an eye on
- The debt wall coming due: US$936 billion in real estate debt to refinance in 2026, at rates well above the originals, with the risk that “extend and pretend” only delays — without resolving — the price correction facing the weakest buildings (CRE Daily, 2026).
- Too many eggs in one tech basket: roughly 26% of direct lending portfolios are exposed to software, right as artificial intelligence starts to call that business’s staying power into question (CAIA, 2026).
- A liquidity mismatch still unresolved: non-listed BDCs promise quarterly liquidity on assets that, in reality, can’t be sold off quickly, and the jump in redemptions — from 1.6% to 4.8% of these vehicles’ value — has already put that design to the test (CAIA, 2026).
- Return quality quietly eroding: more “problem” deferred payments (6.4% of loans) and fewer protective clauses (roughly 70% of issuance without robust covenants) may be inflating the return reported on paper while real cash flow weakens underneath (CAIA, 2026).
- A Fed that might just sit tight: there’s a 30% to 40% chance of no rate cut at all in 2026, which would keep the cost of money elevated for longer, both for whoever’s refinancing a building and for whoever owes a private credit loan (PrimeRates, 2026).
- Less visibility right when it’s needed most: new disclosure rules could cut down the information available on modified real estate loans, making it harder to spot in time where the real risk is hiding (CRE Daily, 2026).
Who’s Winning and Who’s Losing Within Each Camp
Real Estate
Within the world of buildings, not every segment is writing the same chapter. Senior housing and hotels/resorts are leading the conversation for different reasons — demographic demand for the former, returning risk appetite for the latter (Capital Economics, 2026; Nareit, 2026). Industrial is still working through the oversupply the pandemic left behind, though the newest assets in key locations remain in demand, and grocery-anchored retail keeps showing solid fundamentals simply because there’s almost no new supply competing for tenants (CBRE, 2026). Office, the perennial bearer of bad news these past few years, is showing a more visible recovery in gateway markets and hubs tied to AI and finance (CBRE, 2026). Multifamily — apartment buildings — is starting to see the oversupply that had been squeezing rents ease off, opening room to redeploy capital into high-growth markets (CBRE, 2026).
Private Credit
On the private credit side, traditional direct lending to mid-sized companies remains the anchor segment, but the most interesting growth story of 2026 is in real estate-focused private credit, which is stepping in for the banks precisely in refinancing the maturity wall we described earlier (CRE Daily, 2026). Also gaining ground is so-called asset-based lending, loans backed by collateral more tangible than plain software (Capstone Partners, 2026). Non-listed BDCs, despite the recent redemption noise, remain the dominant vehicle for getting private credit into high-net-worth investors’ hands, though their quarterly-liquidity promise is now under the industry’s own microscope (CAIA, 2026).
What to Do With This Story If You’ve Got Capital to Put to Work
If this story had one practical takeaway for anyone weighing where to put capital to work, it’s this: the 2026 environment rewards selectivity far more than it rewards riding the index average. In private credit, it pays to look harder at managers with disciplined underwriting, a low share of problem deferred payments, and light exposure to sectors where tech disruption calls the borrower’s cash flow into question. In real estate, the clearest window is in debt and equity strategies able to source off-market deals right in the 2026–2027 maturity segment, where owners sitting on old, low-rate debt are going to need fresh capital — via mezzanine debt, preferred equity, or recapitalizations — rather than selling on unfavorable terms.

VenQuest’s bottom-line playbook, spelled out plainly: prioritize manager and sector selectivity over passive exposure to the index average; draw a clear line between the risk profile of corporate private credit (more exposed to sector concentration) and real estate private credit (more exposed to collateral quality and to how disciplined the loan-to-value underwriting was); keep close tabs on variables like BDC redemption rates, how problem deferred payments evolve, the pace of cap rate compression, and where the Fed is headed; and, above all, don’t lose sight of the fact that the size of the premium in the market average is no guarantee any single vehicle will capture it without a bumpy ride.
Implications for VenQuest
For the VenQuest team talking with institutional investors and family offices every day, this half-year leaves behind a genuinely valuable conversation, not just a rundown of figures: the return premium between private credit and real estate is still compelling, but it no longer holds up just by pointing at the index level. VenQuest Research recommends anchoring those conversations in deep manager due diligence — how they build their reported return, how concentrated they are in one sector, how robust their protective clauses are — and in the tactical window real estate’s own maturity wall opens up to deploy fresh capital into debt and equity structures built to protect value. Told well, this reading also positions VenQuest as the natural go-to voice for translating this convergence between both asset classes into concrete portfolio decisions, at a moment when plenty of clients are navigating this fork in the road with no clear frame of reference.
An Epilogue: Same Story, Different Backdrop
Before we wrap up, it’s worth a quick note on a different backdrop where the exact same plot is playing out.
The line between real estate and private credit we’ve traced throughout this document is also taking shape, on a smaller scale but with the same logic, in the physical infrastructure of the space economy: data centers, launch facilities, and next-generation orbital assets are now being financed with a growing mix of structured private debt and specialized real estate vehicles. It’s a storyline VenQuest Research will keep following, with the same narrative care, in our monthly Space Economy coverage through the second half of 2026.
References
- Capital Economics. (2026). NCREIF Q1 2026: Little divergence in regions and core sectors. https://www.capitaleconomics.com/publications/us-commercial-property-update/ncreif-q1-2026-little-divergence-regions-and-core
- Capstone Partners. (2026). Middle Market Leveraged Finance Update — Q1 2026. https://www.capstonepartners.com/insights/middle-market-leveraged-finance-report/
- CBRE. (2026). U.S. Real Estate Market Outlook 2026 — Capital Markets. https://www.cbre.com/insights/books/us-real-estate-market-outlook-2026/capital-markets
- Chartered Alternative Investment Analyst Association (CAIA). (2026). Private credit redemptions, defaults, and wrappers, oh my! https://caia.org/blog/2026/04/20/private-credit-redemptions-defaults-and-wrappers-oh-my/
- Cliffwater. (2026). Cliffwater Direct Lending Index data supports strength of private credit [Press release]. PR Newswire. https://www.prnewswire.com/news-releases/cliffwater-direct-lending-index-data-supports-strength-of-private-credit-302730370.html
- Connect CRE. (2026). NCREIF reports improving Q2 returns for key quarterly indices. https://www.connectcre.com/stories/ncreif-reports-improving-q2-returns-for-key-quarterly-indices/
- CNBC. (2026, March 19). Real estate could be the big winner in the private credit exodus. https://www.cnbc.com/2026/03/19/real-estate-winner-private-credit-exodus.html
- CRE Daily. (2026). Debt maturities rise amid 2026 CRE pressure. https://www.credaily.com/briefs/debt-maturities-rise-amid-2026-cre-pressure/
- Nareit. (2026). 2026 mid-year update: REITs rebound, poised for future gains and growth. https://www.reit.com/news/blog/market-commentary/2026-mid-year-update-reits-rebound-poised-future-gains-and-growth
- PrimeRates. (2026). Fed rate forecast 2026: How many cuts? When will rates go down? https://primerates.com/primerate/fed-rate-forecast-2026/